Updated on
July 11, 2026
Visible Learning: Hattie Effect Sizes & Strategies
John Hattie's Visible Learning explained: what effect sizes mean, the 0.4 hinge point, and the teaching strategies with the biggest impact on achievement.


Updated on
July 11, 2026
John Hattie's Visible Learning explained: what effect sizes mean, the 0.4 hinge point, and the teaching strategies with the biggest impact on achievement.
What is visible learning?
Visible learning is John Hattie's framework, drawn from a synthesis of over 800 meta-analyses, that uses effect sizes to identify which teaching practices most improve achievement. Its real value is the mindset, not the rankings: making learning visible means teachers and learners can see the impact of teaching and adjust accordingly.
Visible Learning: Hattie Effect Sizes & Strategies is a teaching framework drawn from John Hattie's synthesis of over 800 meta-analyses (Hattie, 2009), using effect sizes to ask which practices are likely to make learning visible to teachers and learners. Its practical value is not the ranking itself. It is the habit of checking whether a chosen strategy changed what learners understood, could explain, or could do next.
Think of a Year 8 science teacher teaching particle models. Rather than posting an objective and moving on, she uses hinge questions, annotated examples and exit tickets to test whether learners can explain diffusion in a new context. The evidence then flows back to the teacher: if misconceptions remain, tomorrow's lesson changes. That feedback loop is the real promise of visible learning, especially when schools compare it with the EEF Toolkit and local assessment evidence.
The original Visible Learning synthesis ranked 138 influences on achievement. Visible Learning: The Sequel expanded the learning synthesis to over 2,100 meta-analyses relating to achievement and more than 350 influences (Hattie, 2023). An effect size shows the magnitude of an impact. In John Hattie's visible learning framework, d = 0.40 is an average effect size or hinge point, not a statistical-significance threshold. Teachers should use it as a prompt for inquiry, then test impact against local evidence.
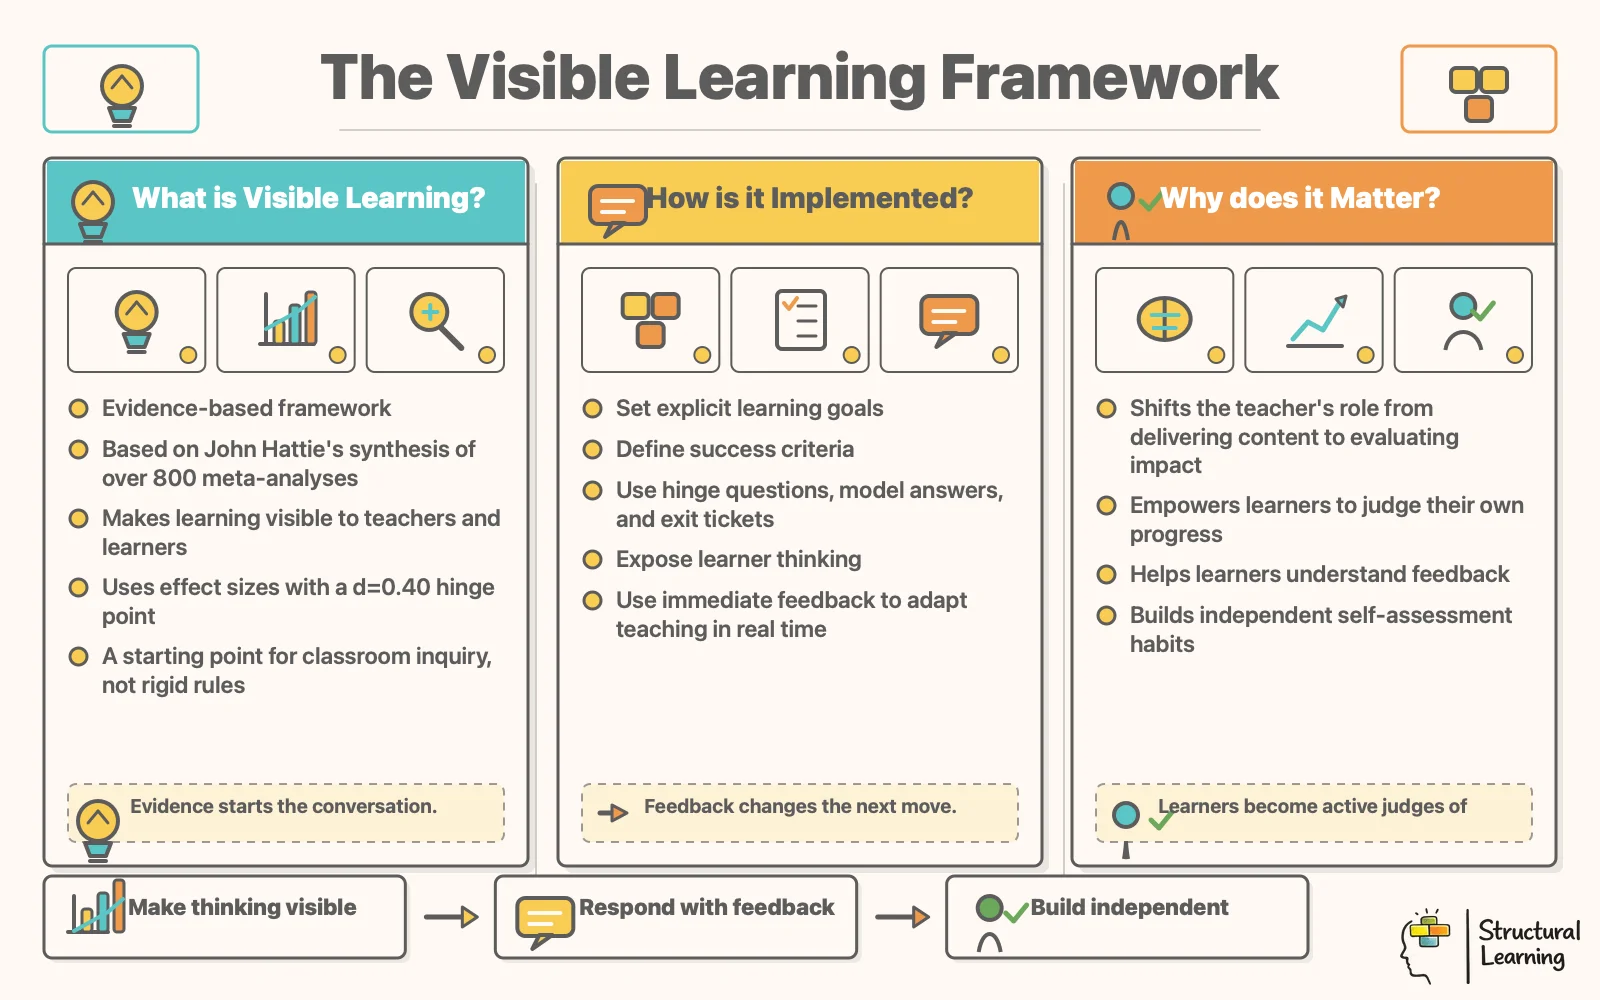
The visible learning teachers need is concrete: learners know the goal, see examples of quality, receive feedback they can act on and learn to judge their own progress. Teachers use questioning, model answers and self-assessment to expose thinking. In a Year 5 writing lesson, this can mean comparing two introductions, naming the stronger use of evidence and revising one sentence before moving on.
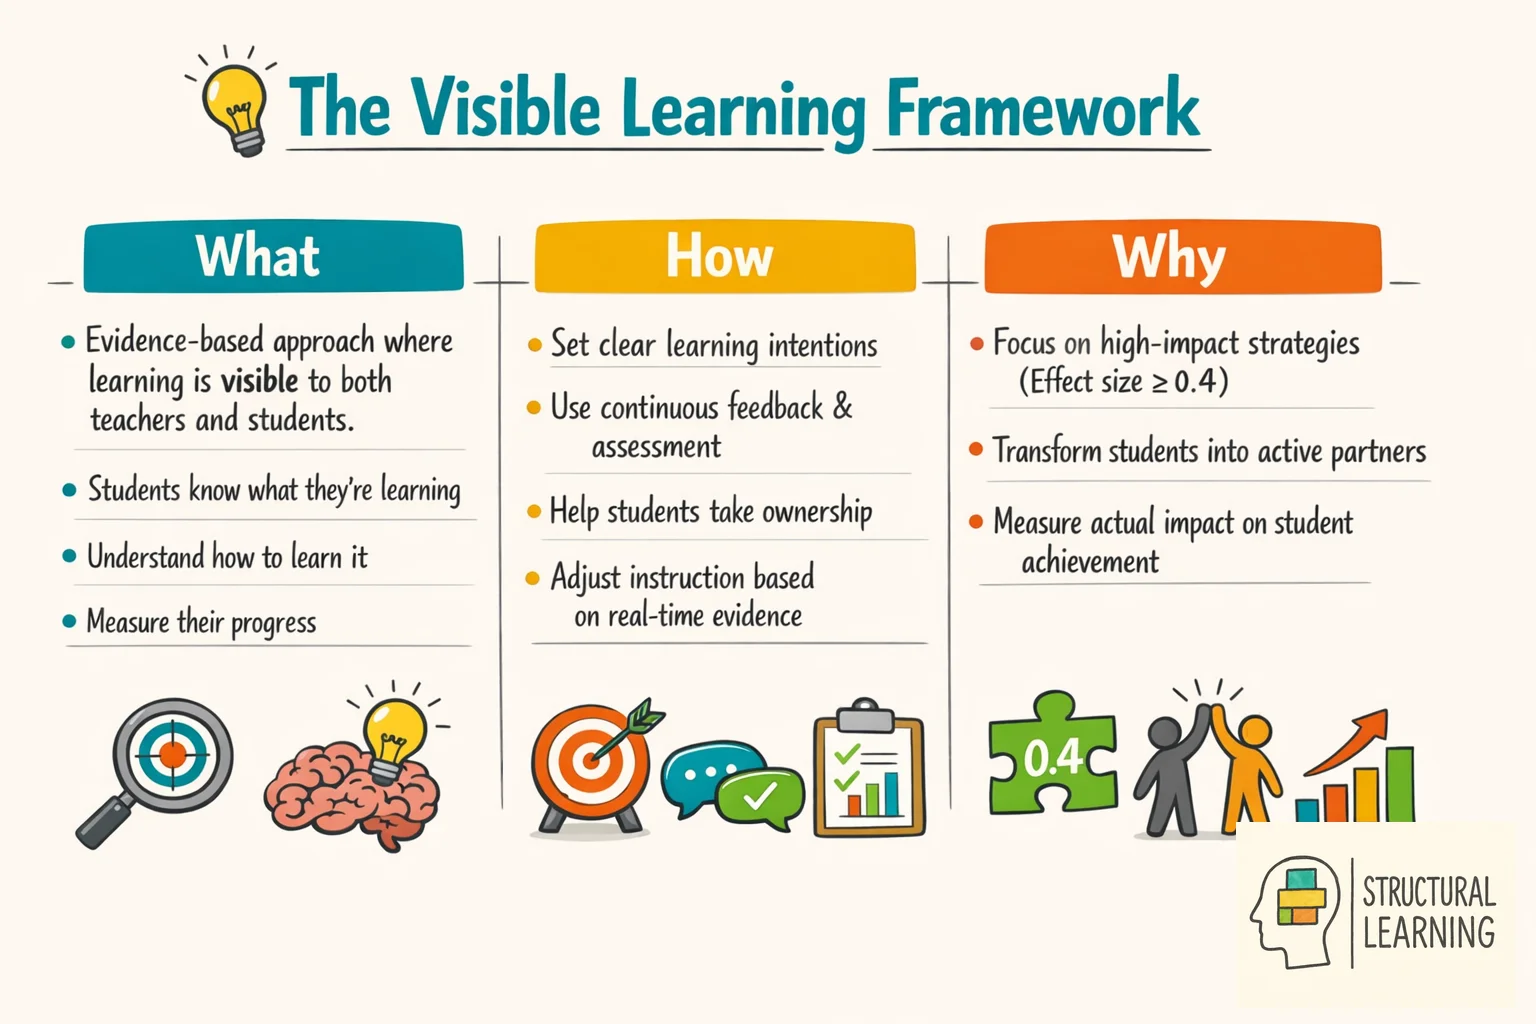
Visible Learning is an evidence-based approach to teaching developed by education researcher John Hattie. At its core, learning should be visible to teachers and to learners themselves. Learners need to know what they are learning, how to go about learning it and how to measure their progress. Hattie's work shifts the focus from delivering content to evaluating the impact of teaching on learner achievement.
What does the research say? Hattie's (2009) Visible Learning synthesis analysed 800+ meta-analyses covering 80+ million learners. The average effect size across all interventions is d = 0.40 (the "hinge point"). Top influences include collective teacher efficacy (d = 1.57), self-reported grades (d = 1.44), teacher credibility (d = 0.90) and feedback (d = 0.70). The key insight: teachers must see learning through learners' eyes and make the learning process visible.
Hattie (dates unspecified) used effect sizes to show impactful teaching strategies. This came from analysing thousands of studies on learners. Hattie found good teaching means seeing learning through learners' eyes. It also involves helping learners teach themselves.
The Visible Learning model places strong emphasis on:
Hattie (2012) stated teachers watch how learners progress. Teachers change lessons based on what works, Black and Wiliam (1998) found. Christodoulou (2017) showed effective teachers make daily informed decisions.
Key Principles of Visible Learning:
Visible learning asks teachers to judge their impact. John Hattie said teachers should view learning as learners do. This helps teachers guide learners to teach themselves. (Hattie, date not provided).
Hattie (dates not included) used effect sizes to analyse millions of learners. He compared teaching strategies' impact on learner achievement, such as feedback and class size.
Hattie (2009) showed feedback has a 0.7 effect size. Formative evaluation scores 0.9, according to research. Collective teacher efficacy (1.57) happens when teachers believe they help every learner (Hattie, 2009; Visible Learning). These scores offer teachers clear classroom focus areas.

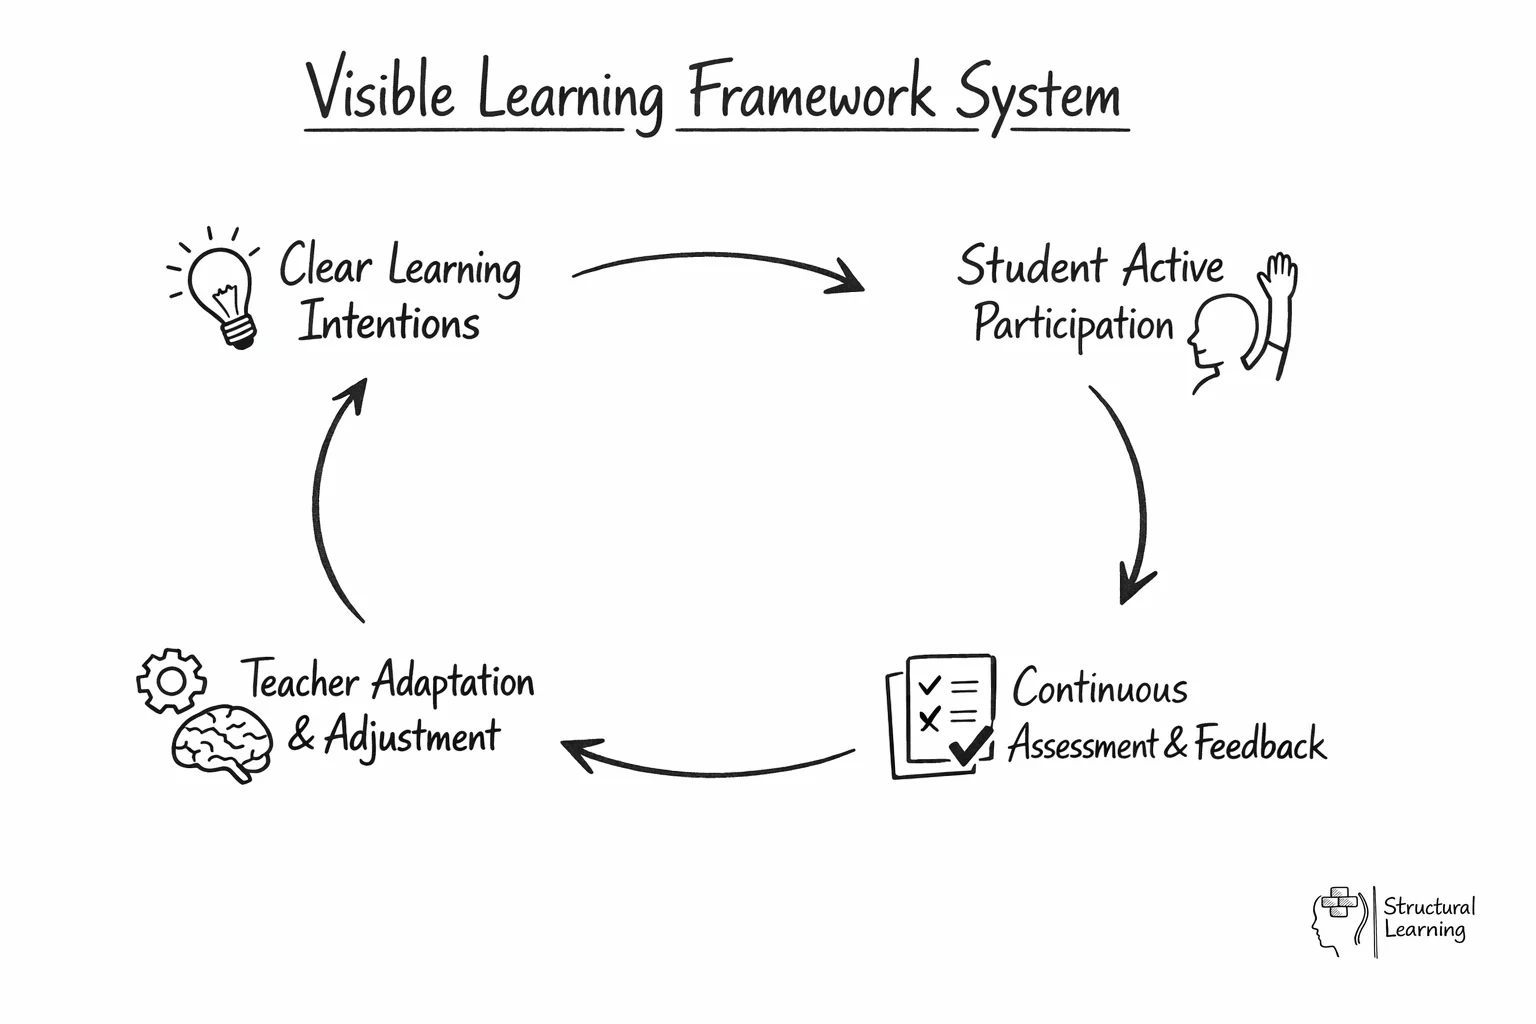
Visible Learning changes classrooms; Hattie (2012) says share learning goals and success criteria. Learners grasp aims and how to achieve them. Teachers check learner understanding using assessments and questions. Instruction changes based on this. Black and Wiliam (1998) found learners self-assess and give feedback, building shared responsibility.
Visible learning involves teachers stating lesson aims and success criteria clearly (Hattie, 2009). Teachers check learner understanding with regular assessments. They then change teaching based on feedback. Teachers guide learners to see where they are and what to do next (Black & Wiliam (Wiliam, 2011), 1998).
John Hattie's Visible Learning synthesis drew on over 800 meta-analyses covering more than 50,000 studies and about 80 million learners. Later visible learning synthesis meta-analyses relating to achievement extend that evidence base, so the list should not be treated as fixed. A larger effect size usually signals a stronger average effect, but it does not remove the need for professional judgement. In practice, visible learners can:
Weinstein and Acee (2020) found that independent learners achieve better outcomes. Rosenshine's (2012) principles give teachers a clear structure for effective teaching. They combine modelling, guided practice and regular checks for understanding. Zimmerman (2002) showed that clear direction helps learners develop self-regulation.
Visible thinking relies on strong questioning. Teachers use questions to check learner understanding, guiding progress. Thinking routines combined with this help make thinking clear (Ritchhart & Perkins, 2011).
Hattie (2008) showed visual tools help learning. Graphic organisers connect ideas for learners. Novak (1998) and Ausubel (2000) found these tools let learners track knowledge.
Hattie (2008) says learners need varied support. Teachers change strategies for learners with special needs. This helps all learners take part effectively.
Understanding information processing helps teachers support learning. Hattie (2009) says working memory is limited, so learners need support with thinking. Willingham (2009) and Sweller (1988) suggest lessons should take these limits into account.
Learner motivation matters for visible learning success. Learners who see progress and know goals become more invested. This boosts ownership of their education (Hattie, 2012; Deci & Ryan, 2000).
Hattie's (2008) Visible Learning combines a lot of research. It uses 800 meta analyses of 50,000 studies and 80 million learners. This shows teachers what really helps learner achievement. Hattie turns research into actions for classrooms.
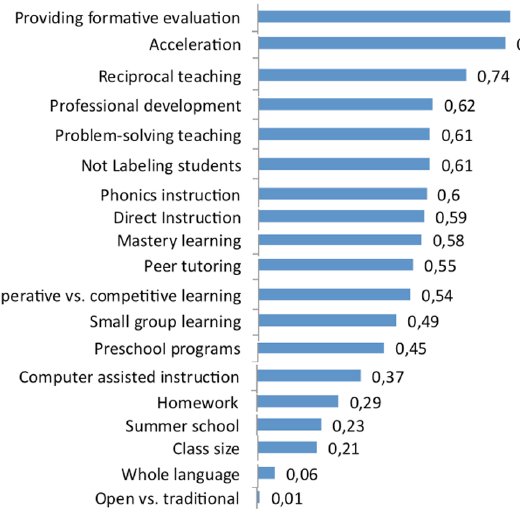
Hattie (2009) used effect sizes to show impact of teaching. Learners gain 0.40 yearly, marking average growth. Strategies above 0.40 show bigger learning impact. Lower effect sizes mean less value, even if time-consuming (Hattie, 2009).
Hattie (2009) and Black & Wiliam (1998) help teachers keep learning in focus. Feedback, formative assessment, and metacognition help learners make better progress. Use methods backed by research; don't just follow trends.
Effect sizes help teachers judge how well practices improve learner outcomes. They show how much impact practices have, not just if they work. John Hattie (n.d.) found 0.40 is average yearly learner progress. This benchmarks teaching approaches, like Hattie's meta-analysis shows.
Teachers can use effect sizes to shape professional development and classroom choices. Hattie's research (date not given) showed feedback scores 0.70, making a real difference. Ability grouping scores 0.12 (Hattie, date not given), offering limited benefit. Practices above 0.40 accelerate learner progress more than those below.
Teachers can use effect sizes from Hattie (2008) to focus efforts on impactful actions. Instead of chasing trends, use strategies proven to work, says Visible Learning (2018). Consider feedback systems, formative assessment from Black & Wiliam (1998), or teacher-learner connections. These exceed a 0.40 effect size threshold (Coe, 2002).
When John Hattie published Visible Learning in 2009, he brought together 800 meta-analyses. These covered more than 50,000 studies and roughly 80 million learners. He used Cohen's d to compare effects across studies. Cohen's d is a standardised measure of the difference between a treatment group and a control group, expressed in standard deviations (Cohen, 1988).
A d of 1.0 means the average learner in the treatment group outperformed 84 per cent of learners in the control group. A d of 0.20 is small, 0.50 is moderate and 0.80 is large. This is why effect sizes can help teachers compare broad claims, but they cannot decide a lesson plan on their own.
Hattie's key contribution was the hinge point of d = 0.40, which he calculated as the average effect size across the influences he examined. He proposed it as a baseline: an approach below 0.40 is producing less than typical yearly growth, even when the approach is popular or heavily resourced.
Approaches above 0.40 suggest stronger acceleration, but the value is still an estimate. The practical question changes from "does this work?" to "does this work better than normal teaching for these learners, in this subject, at this point in the curriculum?" (Hattie, 2009).
Hattie (2009) says meta-analysis calculates the effect size for each study. Researchers then average these effect sizes and weight them by sample size.
Hattie (2009) then averaged meta-analyses to rank interventions. This separates classroom data from external comparisons. A d=0.60 can show teacher-learner interactions.
Kraft (2020) found pre-post gains inflate effect sizes compared to control groups. Hattie's database includes pre-post designs, so the 0.40 hinge point is likely to be too high. Teachers can still use Hattie's rankings, but precise d values are not reliable. View the hinge point as a filter, not an exact cut-off.
Teachers and learners benefit from clear teaching. Hattie's research shows feedback, classroom discussion and formative evaluation can raise learner achievement when they are implemented with care. These practices also give teachers evidence they can use during the lesson.
Sweller (Sweller, 1988)'s cognitive load theory (Sweller, 1988) explains why worked examples and staged support help learners focus on the content rather than the format of the task. Wiliam's formative assessment work (Wiliam, 2011) shows why feedback should change teaching as well as learner answers.
Teachers must assess their impact on learners. Collect evidence of learning using exit tickets, discussion, mini-whiteboards and journals (Hattie, 2012). Seeing what works lets teachers change practice and improve learner outcomes (Black & Wiliam, 1998). Responsive teaching, based on learning evidence, matters most (Christodoulou, 2017).
Hattie's research shows that collective teacher efficacy has a very high effect size (d = 1.57). This is higher than any single teaching method. Bandura (1977, 1997) defined efficacy as belief in the capacity to act successfully, first for individuals and later for groups. Schools benefit when staff believe their actions can improve outcomes for all learners, including disadvantaged learners.
Donohoo (2017) linked Bandura's theory to school improvement. She found that six factors build collective teacher efficacy, which is teachers' shared belief that they can improve learning.
These factors include having a say in decisions, sharing goals, knowing colleagues' work, and having good staff relationships. Donohoo (2017) also says leaders should respond to teacher worries, because weak support makes it harder for teachers to improve results.
Shared beliefs on impact boost staff actions. Teachers expect more from every learner (Donohoo, Hattie and Eells, 2018). They support struggling learners, avoiding blame. Staff share results, moving past solo work. Learners see consistent high standards across the board.
For school leaders, the message is practical: build ways for staff to work together before buying another programme. A school may buy a literacy intervention, but get less from it if departments still work alone. Leaders are more likely to see stronger results when they protect shared planning time, lesson study and careful review of learner evidence.
The effect size of d = 1.57 does not mean belief alone raises attainment. It describes the pattern found when staff collectively act on the belief that they can improve outcomes for every cohort. In a UK school, this can sit inside low-cost CPD, Early Career Framework mentoring and Ofsted-ready evidence of impact without requiring a commercial Visible Learning package.
Hattie (2012) shows learning intentions clarify aims. Learners understanding purpose and quality improves results, says Clarke. Learning intentions use clear language, focusing on skills not tasks (Clarke). Use it as a starting point for professional discussion: identify the learner's current need, record evidence from more than one lesson, and agree the next classroom adjustment with the SENCO or family.
Success criteria make clear what learners should achieve. Wiliam (date unknown) showed that co-creation can boost learner engagement. Specific, measurable criteria help learners check their progress. Sadler (1989) found that they link to learning intentions and help learners understand quality.
Share learning intentions and success criteria clearly. Refer to them often during lessons. Learners can use them for self-reflection during activities. Review these criteria at the end so learners can judge their progress.
This tool asks five quick questions. You will get EEF strategy recommendations. They are ranked by impact, cost and evidence strength. Use them to support your learners. Use it as a starting point for professional discussion: identify the learner's current need, record evidence from more than one lesson, and agree the next classroom adjustment with the SENCO or family.
EEF analyses and other research reports show that targeted spending boosts learner progress. Prioritise strategies that offer the best value for money, using budget data to guide choices. This focused use of resources helps learners succeed.
Choose your feedback type, subject, and time constraints to generate a tailored protocol with marking codes, prompt stems, and workload strategies. Use it as a starting point for professional discussion: identify the learner's current need, record evidence from more than one lesson, and agree the next classroom adjustment with the SENCO or family.
Hattie and Zierer (2018) found effective teachers share key beliefs, not just favoured methods. These "mindframes" shape their role and how they use evidence from learner progress. Hattie moved from listing what works to understanding why some teachers excel.
Hattie and Zierer (2018) found ten key mindframes for effective teaching. One mindframe is that teachers see themselves as evaluators of their own impact.
Teachers do this by gathering proof of learner progress and then adapting their teaching. Another mindframe sees learning as finding and fixing errors, so classrooms treat mistakes as data (Hattie & Zierer, 2018).
A third mindframe frames teacher/learner interaction as a learning conversation.
Mindframes involve teachers seeing teamwork as a key duty. They should believe all learners can improve and use learning intentions for planning. Hattie and Zierer (2018) contrasted mindframes with teaching methods. Teachers can use techniques without seeing feedback as personally meaningful.
Mindframes aid teacher training. Hargreaves and Fullan (2012) found shared data analysis improves schools. Effective training links beliefs to teaching skills. Teachers, use observations and assessments for your feedback, not just the learner's.
Hattie and Zierer (2018) identified ten mindframes of highly effective teachers. These mindframes are belief orientations, not separate actions. Learners benefit when teachers use these mindframes in their practice.
| # | Mindframe | Core belief |
|---|---|---|
| 1 | Evaluator of impact | I use evidence of learning to adjust my teaching continuously. |
| 2 | Change agent | I believe my actions can significantly change learner outcomes. |
| 3 | Learning is hard work | I acknowledge that struggle and effort are normal and productive features of learning. |
| 4 | Assessment informs teaching | I use formative data to steer lessons rather than merely grade learners. |
| 5 | Dialogue over monologue | I value conversation about learning rather than transmission of content. |
| 6 | Error as opportunity | I treat mistakes as diagnostic information, not failures. |
| 7 | Collaboration as professional norm | I engage in shared inquiry with colleagues about impact data as a routine, not an event. |
| 8 | High expectations for every learner | I believe all learners can improve and I design tasks accordingly. |
| 9 | Conceptual understanding first | I prioritise deep understanding over surface coverage. |
| 10 | Positive relationships | I build trust and respect as the foundation for cognitive risk-taking in the classroom. |
Visible Learning research (Hattie, 2012) shows focusing on all ten mindframes ensures professional growth. Teachers with mindframes 1 and 4, but not 7, may improve lessons. Lasting school improvement needs attention to all mindframes as development goals.
Hattie and Donoghue (2016) explain Visible Learning data with a learning model. Their research suggests some strategies fail if taught at the wrong phase. Learners gain less when strategies are used at unsuitable times, they state.
Surface learning involves getting facts and skills. Learners need clear teaching and practice at this stage. Worked examples (d = 0.57), direct instruction (d = 0.60) and spaced practice (d = 0.65) help. Kirschner, Sweller and Clark (2006) warned that minimally guided inquiry overloads novice learners when they lack basic knowledge.
Deep learning links facts and skills. Learners form conceptual structures and relate ideas (Hattie & Donoghue). Reciprocal teaching and concept mapping help. These strategies build connections, not just recall (Hattie & Donoghue). Classroom talk works best when learners have prior knowledge.
Transfer learning uses understanding for new problems (Bransford et al., 1999). It's difficult yet valuable. Metacognition and varied problems help learners transfer knowledge. Wiliam (2011) said, "What does this learner need now?" Plan lessons that match each learning phase.
Hattie's research shows feedback often boosts learning. Yet, feedback can also have no impact or a negative effect. Hattie and Timperley (2007) say feedback levels matter. Effective feedback targets the right learner need.
Task feedback (FT) tells learners if answers are right or wrong. It is common in classrooms but less helpful for learning (Hattie & Timperley, 2007). Use it to fix basic errors before moving on. Process feedback (FP) looks at how learners complete tasks. It helps improve strategies, building skills that can transfer (Wiggins, 1998).
Self-regulation feedback (FR) helps learners check their own work. Research shows that this information helps them learn effectively and builds metacognition, the ability to think about their own learning.
Self feedback (FS) focuses directly on the learner. Hattie and Timperley found that FS is less effective and can be harmful, while Dweck (1999) said praising learners as "clever" lowers their willingness to take risks.
This directly impacts feedback policies. A "Good work" comment, (Hattie & Timperley, 2007), helps little. Instead, try: "You found the pattern. Does it work with negative numbers?" (Kluger & DeNisi, 1996). For successful learners, ask: "How did you spot your error?" (Butler & Winne, 1995) to build good habits.
Hattie (2009) found self-reported grades had the biggest impact (d=1.44). This finding sparked interest and some doubt. It does not mean learners mark their own work without thought. Kuncel, Crede and Thomas (2005), and Mabe and West (1982) showed it is how well learners predict results.
Learners with accurate self-predictions understand their knowledge (Hattie). This accuracy comes from past feedback and clear assessments. Regular feedback helps learners measure new learning. Hattie found that learners knowing what they know can guide their learning best.
Learning intentions link to classroom practice. Teachers, share clear success criteria, so learners assess their work. This builds calibration, connected to grades (Andrade & Valtcheva, 2009). Rubrics improve writing more than open tasks. They give learners external standards (Andrade & Valtcheva, 2009).
Black and Wiliam (1998) found self and peer assessment work best with clear criteria. Learners need specific feedback and transparent tasks to understand their progress. Teachers should not be the only source of evaluation.
Download this free Complete Teaching Essentials Bundle resource pack for your classroom and staff room. Includes printable posters, desk cards, and CPD materials. Use it as a starting point for professional discussion: identify the learner's current need, record evidence from more than one lesson, and agree the next classroom adjustment with the SENCO or family.
Hattie and Donoghue (2016) said learning has three phases: surface, deep, and transfer. Surface learning means learners get initial knowledge and skills. For example, a Year 7 learner memorises area formulas. This initial phase is not shallow but provides important knowledge.
Learners achieve deep learning by connecting new knowledge to prior understanding and spotting patterns. They show deep processing when explaining area or predicting dimensional changes. Concept mapping, questioning and peer teaching aid learning (Marzano et al., 2001; Dunlosky et al., 2013; Chi, 2009).
Learners show transfer when they use existing knowledge in new situations. For instance, a learner applies area calculations to estimate paint needed (Hattie, n.d.). Direct instruction helps surface learning well (d = 0.60). Metacognitive strategies boost deep and transfer learning more (d = 0.60, 0.69) (Hattie, n.d.).
Teachers should sequence teaching carefully. Use explicit instruction first, followed by group work as learners grasp concepts. Avoid rushing to deep learning; it causes overload (Kirschner, Sweller and Clark, 2006). Sufficient surface knowledge avoids this.
Hattie (d = 0.84) found teacher clarity impactful, though less discussed than feedback. Fendick (1990) said clarity means lessons are well organised. Clear explanations use simple language and useful examples. Fendick also noted showing work and ensuring learners grasp assessment.
In practice, teacher clarity means that learners can answer three questions at any point during a lesson: What am I learning? Why am I learning it? How will I know when I have learned it? When teachers share learning intentions and success criteria explicitly, and check that learners can articulate them, clarity improves measurably. The effect size of 0.84 places teacher clarity ahead of feedback (0.70) and questioning (0.48), making it one of the most cost-effective improvements a school can make.
Hattie (2008) synthesised over 1,600 meta-analyses. The research covered about 300 million learners and their achievement. He calculated effect sizes (Cohen's d) for each influence. Effect sizes help teachers compare studies. This allows them to weigh evidence better (Hattie, 2008).
The critical threshold is d = 0.40, which Hattie describes as the “hinge point”. An effect size at or above this value represents at least one year’s growth for one year’s input, pushing learning beyond what normal schooling would achieve without the intervention. Influences below 0.40 may still have value, but they do not accelerate progress in the way the most powerful strategies do. The table below shows a selection of key influences and where they sit relative to the hinge point.
| Strategy | Effect Size (d) | Impact Level |
|---|---|---|
| Collective teacher efficacy | 1.57 | Very high |
| Self-reported grades | 1.33 | Very high |
| Teacher clarity | 0.84 | High |
| Classroom discussion | 0.82 | High |
| Scaffolding | 0.82 | High |
| Teacher credibility | 0.90 | High |
| Feedback | 0.70 | High |
| Metacognitive strategies | 0.60 | Medium |
| Direct instruction | 0.60 | Medium |
| Formative evaluation | 0.48 | Medium |
Hattie (2017) found collective teacher efficacy beats any curriculum. Learners accurately predict their grades, say Black & Wiliam (1998). This shows learners know their progress well. These two points matter greatly.
Strategies such as scaffolding and classroom discussion cluster around d = 0.82, well above the threshold. Direct instruction and metacognitive strategies sit at 0.60, still clearly above the hinge point. Formative evaluation at 0.48 clears the bar, confirming that checking for understanding during lessons, rather than only at the end, makes a measurable difference to outcomes.
Feedback varies in classrooms, say Hattie and Timperley (2007), despite its proven impact. They identified four feedback levels. These levels each affect learner progress in different ways.
Task-level feedback addresses correctness: is this answer right or wrong, and what needs to be changed? This is the most common type of teacher feedback and also one of the most effective when it is specific. Telling a learner their calculation is incorrect because they forgot to carry the tens gives them precise information to act on. Vague corrections such as “try again” give task-level feedback without any useful signal.
Process-level feedback targets the strategies used to complete a task. It helps learners understand how they are working, not just whether the work is right. Comments such as “you found the main idea quickly because you looked at the opening sentence of each paragraph first” teach a method that transfers to future tasks, not just to this one.
Self-regulation feedback operates at the level of how learners monitor and direct their own learning. It builds independence by helping learners evaluate their own work, set goals, and know when to seek help. Teachers who model self-questioning strategies, such as “how do I know when I’ve understood this well enough?”, are providing self-regulation feedback.
Self-level feedback addresses the person rather than the performance, and is the least effective of the four levels. Praise such as “you’re so clever” or “well done, you’re brilliant at this” feels positive but gives learners no information about what they did, how they did it, or what to do next. In some cases it can be counterproductive, encouraging learners to avoid challenge so that their self-image as “clever” remains intact. Formative assessment practice that combines task and process feedback consistently produces stronger results than generic praise alone.
Bandura (1977) links self-efficacy to Hattie's ideas. Self-efficacy is a learner's belief they can succeed. Bandura (1977) says this differs from self-esteem. It predicts a learner's effort, mainly with hard tasks.
Bandura (1997) described four sources of teacher self-efficacy. Mastery experiences are successful challenges, and they help learners believe they can improve. This supports Hattie's findings on growth.
Learners also build self-belief through vicarious experience, when they see peers succeed. Verbal persuasion works best when teachers praise effort, not ability. Physiological states show readiness, so lowering test anxiety can improve learner results.
Hattie and Timperley (2007) showed task and process feedback help learners see real progress. This creates mastery. Self-level feedback focuses on worth, not skill. Bandura explained why this rarely helps; it misses the point. Teachers understanding this use specific feedback, showing genuine progress.
Collective teacher efficacy (d=1.57) applies Bandura's idea to school staff. Teams gain it from shared successes (learner data). Seeing others succeed (school visits) helps. Evidence-based persuasion matters, alongside less worry about checks. These build belief in their impact.
Clarke's research (2005, 2014) translates Hattie's findings into routines. Hattie showed that learning intentions improve outcomes (d=0.54). Clarke bridges the gap, showing teachers how to use intentions well in practice.
Clarke (2001) says a task differs from a learning intention. Tasks are activities learners do, like writing. Learning intentions are what learners will learn, like using evidence. Clarke found mixing these reduces learning gains. Learners transfer knowledge better when they understand the learning (Clarke, 2001).
Clarke suggests learners create success criteria together. Ask, "What makes you feel you met the learning goal?" This helps learners understand quality, says Clarke (2001). Learners self-regulate better when they help build criteria. Clarke's research proves this works well for writing tasks.
Clarke (n.d.) suggests teachers check lesson plans; aims must describe learning, not just activity. Try one co-construction session weekly. Compare learner self-assessments with teacher criteria. You should see improvement in revisions within four weeks. (Clarke, n.d.)
Sweller's cognitive load theory (Sweller, 1988; Sweller, van Merrienboer & Paas, 1998) explains Hattie's learning phases. Rushing learners from surface to deep learning causes performance issues Hattie noted. The theory outlines three types of load on working memory. Working memory holds around four items (Cowan, 2001).
Intrinsic load reflects subject difficulty (Sweller, 1988). Complex topics raise intrinsic load for the learner. Teachers can sequence learning to build basic knowledge structures. Surface learning develops these structures and reduces load.
Activity design creates extraneous load (Chandler & Sweller, 1991). Unclear materials raise this load and hinder learners. Visuals and examples reduce extraneous load during lessons. Learners use effort to create knowledge structures; this is germane load (Sweller, Ayres & Kalyuga, 2011).
Kalyuga et al. (2003) found differentiation helps learners by offering varied support. Worked examples aid new learners, but can slow experts. Reduce support as learners improve to control workload. Hattie noted direct teaching (d=0.60) suits early learning. Later, learners need to reorganise knowledge independently for transfer.
Scaffolding, according to cognitive load theory, should fade gradually for classroom use. Break complex tasks into worked examples (Sweller, 1988) before learners tackle problems. Assessment tasks must match each learner's current knowledge (Clark, 2009; Kalyuga, 2007).
Rosenshine's (2012) principles come from cognitive science research. Studies of expert teachers also inform the work, as does learning support research. These ten principles fit Hattie's work since they use similar evidence. Both researchers see clear, structured teaching as key for learner progress.
| Rosenshine principle | Hattie equivalent | Effect size (d) |
|---|---|---|
| Begin with a short review of previous learning | Retrieval practice / spaced learning | 0.62 |
| Present new material in small steps | Direct instruction (surface phase) | 0.60 |
| Ask many questions and check understanding | Formative evaluation | 0.48, 0.90 |
| Provide models and worked examples | Worked examples | 0.57 |
| Guide practice during initial learning | Teacher clarity / scaffolding | 0.84 / 0.82 |
| Check for understanding throughout | Feedback (task level) | 0.73 |
| Aim for a high success rate (80% +) | Self-reported grades (calibrated expectation) | 1.44 |
| Provide scaffolds for difficult tasks | Scaffolding | 0.82 |
| Require and monitor independent practice | Self-regulation / metacognitive strategies | 0.60 |
| Engage learners in weekly and monthly review | Spaced practice | 0.65 |
Rosenshine (2012) studied lesson techniques using Sweller's cognitive science. Hattie's (2008) meta-analyses found similar effects in schools. Teachers can use both sets of ideas, as Rosenshine's practices match Hattie's findings.
Use the table to check lesson plans quickly. Plans missing elements from the left column likely won't achieve effect sizes shown (Hattie, n.d.). Teachers often miss principle 3 (questions, checking understanding). This relates to formative evaluation, a key area in Hattie's (n.d.) research.
Bandura, A. (1977). Social learning theory.
Hattie, J. (2009). Visible learning.
Kirschner, P. (2006). Why minimal guidance during instruction does not work.
Rosenshine, B. (2012). Principles of instruction.
Sweller, J. (1988). Cognitive load during problem solving.
Wiliam, D. (2011). Embedded formative assessment.
Visible learning, based on Hattie's (2009) research, gives practical tools. Research by Marzano (2003) and Black & Wiliam (1998) also supports it. These studies help teachers understand how learners learn best in class.
Hattie's (2008) "Visible Learning" combines over 800 meta-analyses. This research looks at factors influencing learner achievement. The work is cited a lot (6,865 times).
Hattie, J. (2009)
Hattie's work (2009) synthesised studies and ranked 138 teaching influences. Feedback (d=0.73), teacher clarity (d=0.75) and formative evaluation (d=0.90) showed the biggest impact. Teachers can use this to prioritise their time, according to Hattie (2009).
Visible Learning for Teachers: Maximizing Impact on Learning 1,147 citations
Hattie, J. (2012)
This book uses meta-analysis for classroom plans. Hattie asks that teachers "know thy impact" (Hattie, n.d.). Checking their impact helps teachers improve their practice. The book gives checklists, lesson plans, and self-checks based on research (Hattie, n.d.).
The Power of Feedback View study ↗ 6,378 citations
Hattie, J. and Timperley, H. (2007)
Hattie and Timperley's (2007) model has four feedback levels. These are task, process, self-regulation, and self. Research shows task and process feedback works best. Self praise gives learners the smallest boost, according to Kluger and DeNisi (1996). Use this model to improve learner progress (Wiliam, 2011).
Teachers Make a Difference: What Is the Research Evidence? View study ↗ 1,310 citations
Hattie, J. (2003)
Hattie (2003) estimated that teachers account for about 30% of the variance in learner achievement. This makes it the top school factor. Expert teachers challenge learners and expect much, research shows (Wright et al., 1997). This work informed Hattie's (2009) visible learning framework.
Embedding Formative Assessment: Practical Techniques for K-12 Classrooms
Wiliam, D. (2011)
Wiliam supports Hattie's visible learning research. He suggests five formative assessment strategies for teachers. These include clarifying learning aims and leading class discussions. Learners can also teach each other (Wiliam, date not included; Hattie, date not included).
Slavin (2018) said Hattie's rankings compare "apples and oranges". Hattie's data merges varied meta-analyses, even sports coaching. He averages effect sizes from different contexts, as if comparable. For instance, feedback in medicine and literacy create one value. Learners, tasks, and tools greatly differ (Slavin, 2018).
Simpson (2017) questioned averaging effect sizes in meta-analyses. Different study criteria make the average less clear. Effect sizes compare groups, yet standardisation reduces the differences. Simpson showed Hattie's table gives a false sense of precision. D values show research flaws, not what makes strategies work (Simpson, 2017).
Bergeron (2017) questioned whether research translates to real classrooms. Hattie's database includes studies that differ from daily teaching.
These studies often used short interventions and volunteer learners. Sometimes, researchers delivered the teaching and designed the tests.
A six-week trial with d=0.60 is likely to shrink across a year (Bergeron, 2017). This shows that the research context impacts the effect size.
Visible Learning still has worth. It orders influences; teacher thinking, feedback, and learner self-regulation are key, aligning with the EEF toolkit and Rosenshine’s work. However, don't see a d value as a precise forecast. Hattie (2015) said effect sizes prompt inquiry, not dictate actions. Use research to question practice, not just rank strategies.
Predict, then reveal
How well do you actually know the research? For each teaching approach, drag the slider to predict its impact, in additional months of progress per year, then we'll show you the figure from the Education Endowment Foundation's Teaching & Learning Toolkit, and how close you got.
Your calibration
| Approach | Months | Cost |
|---|
Figures are months of additional progress from the EEF Teaching and Learning Toolkit (verified June 2026).
Hattie's Visible Learning helps teachers and learners see progress. Learners should understand learning goals and how to track development. This approach values teaching's impact on learner success (Hattie, n.d.). Teachers guide learning and adjust lessons based on data (Hattie, n.d.).
Share lesson aims and success criteria clearly. Learners need to understand what they're learning. Check learner understanding with questions and quick assessments during lessons. Adapt your teaching based on this, as Hattie (2012) suggests. Teach learners to self-assess and offer useful feedback, as Black and Wiliam (1998) advise.
Visible Learning helps learners actively set goals and track progress. Teachers gain evidence-based strategies: Hattie (2009) found feedback scores 0.7. Formative evaluation reaches 0.9, Hattie (2009) showed. Teachers understand learning from the learner's view and use evidence to guide choices.
Hattie (2009) says 0.4 is the "Zone of Desired Effects" for learning. Strategies above 0.4 likely improve learner outcomes. Approaches below 0.4 may not significantly help, research shows. Knowing this helps teachers choose worthwhile interventions.
Learners should say what they learn and why, plus seek feedback and set goals. See learners self-assessing work and giving peer feedback (Black & Wiliam, 1998). Teaching choices then better meet learner needs, using ongoing lesson assessment evidence (Hattie & Timperley, 2007).
Teachers often share objectives, but do learners know how to self-assess? Many collect data without adjusting lessons (Hattie, 2009). Some think posting intentions equals Visible Learning, but it needs learner input and feedback loops (Fisher & Frey, 2012).
Hattie and Timperley (2007) show that feedback can influence learning, but the strongest feedback in visible learning flows from learner to teacher. Exit tickets, hinge questions and draft annotations tell the teacher what learners understood, what they guessed and where the explanation failed.
Effective feedback answers three questions: Where am I going? How am I going? Where to next? Link feedback to learning intentions and success criteria. Instead of marking right or wrong, address patterns in learner understanding and adjust the next lesson.
Specific praise such as "your evidence strengthens the argument; now apply it to the conclusion" gives learners information they can use. Peer feedback and self-assessment improve learning when criteria are clear (Black & Wiliam, 1998). Learners then become more accurate judges of their own progress.
Teachers in Visible Learning classrooms talk about learner progress often. They treat formative assessment as an information system, not a marking routine (Wiliam, 2011). Exit tickets, peer feedback and mini-whiteboard checks help teachers decide the next teaching move.
Share learning intentions and success criteria clearly. Then involve learners in judging their own work. Self-assessment builds metacognition and self-regulation. Learners learn to monitor, direct and adjust their approach, instead of waiting for the teacher to diagnose every gap.
Traffic lights, one-minute summaries and rubric-based peer assessment only help when teachers use the evidence they give. Use assessment data to change groups, explanations, examples or practice tasks. This creates more responsive classrooms (Black & Wiliam, 1998; Hattie, 2012). Respond quickly to what went well and to errors (Sadler, 1989).