Thinking Maps for Deeper Learning
Learn how thinking maps and visual tools help students develop critical thinking skills, organise complex ideas, and improve learning across all subjects.


Learn how thinking maps and visual tools help students develop critical thinking skills, organise complex ideas, and improve learning across all subjects.
Thinking Maps for Deeper Learning describes eight structured visual frameworks. They help learners define, describe, compare, sequence, classify, analyse parts, explain causes and make analogies across the curriculum. Hyerle developed these maps as a shared classroom language for thinking, not as decorative worksheets (Hyerle, 2009). They also reflect wider evidence that learners remember and reason better when clear visual structures sit alongside verbal explanations (Paivio, 1986; Mayer, 2009).
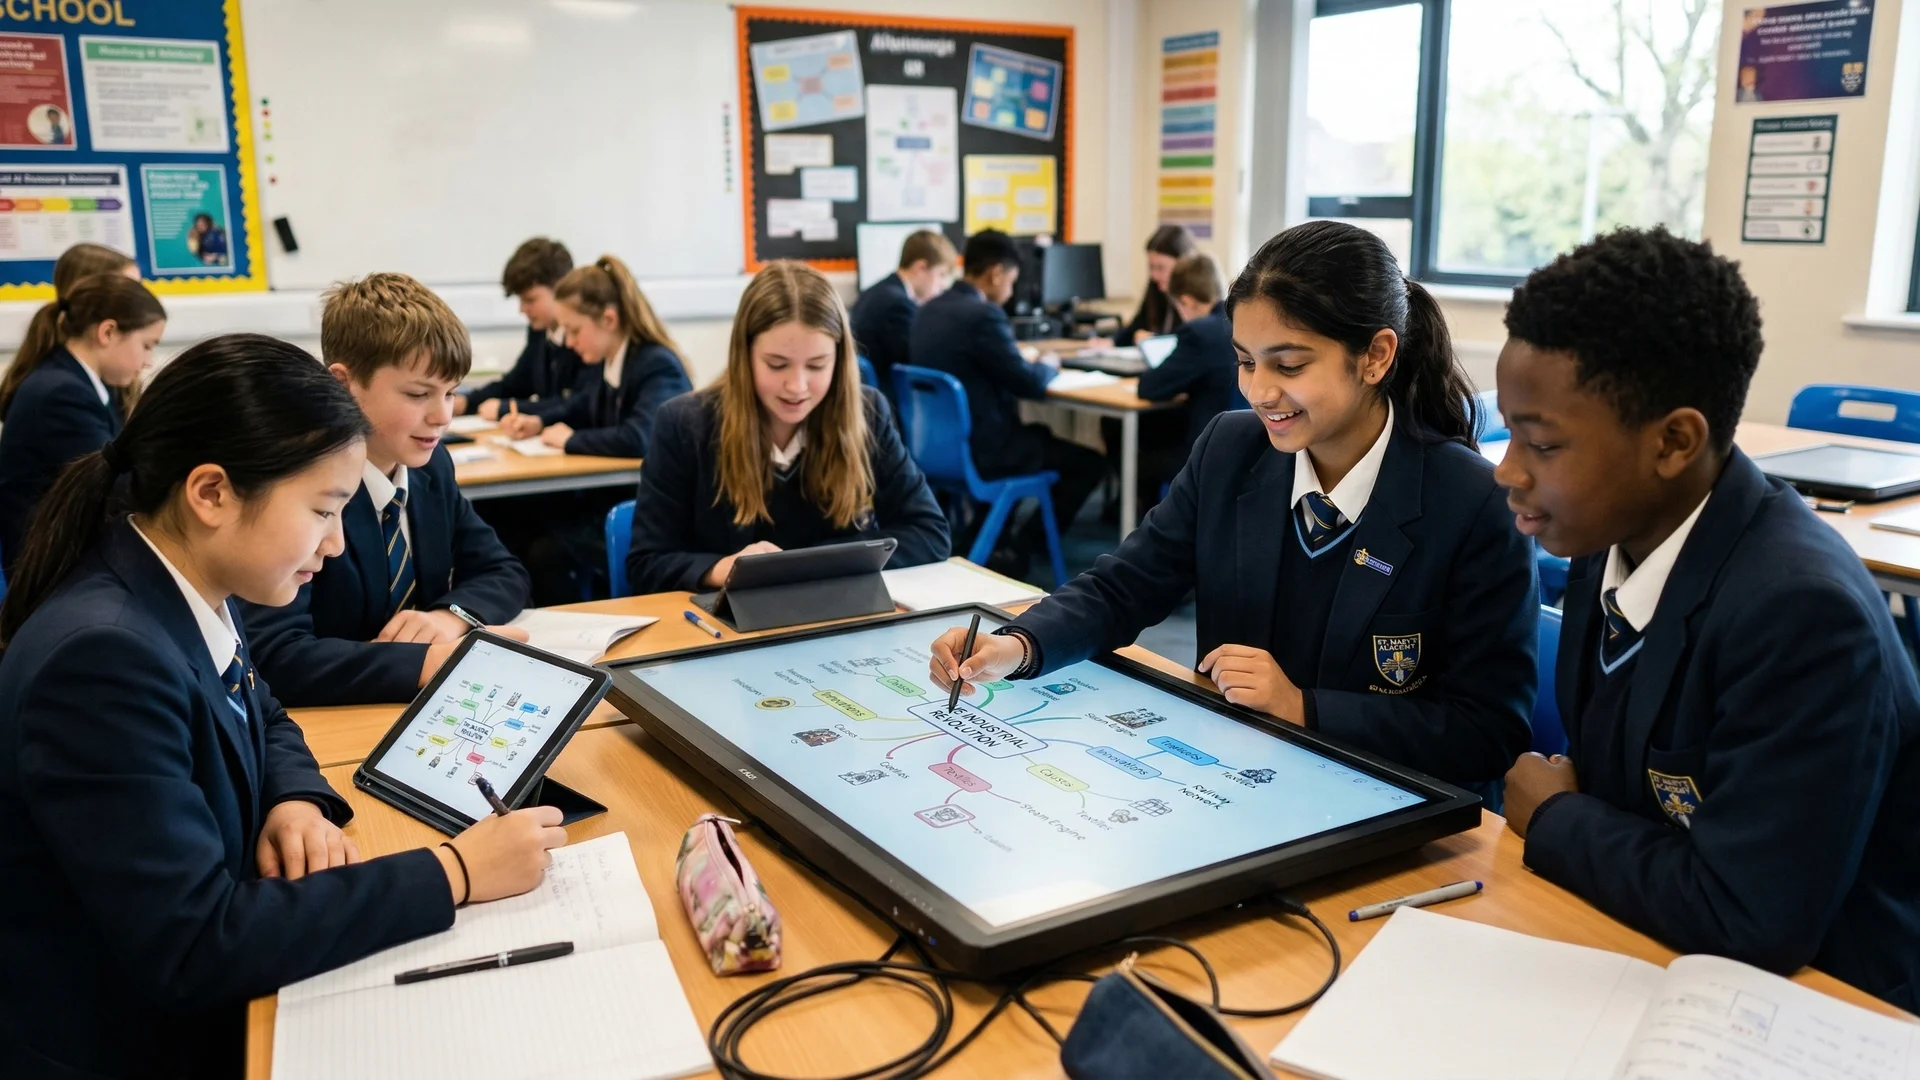
For example, a Year 8 history class might use a Multi-Flow Map to separate the causes and consequences of the Industrial Revolution, then add precise linking words such as "led to", "reduced" and "increased". The teacher can then see where learners are listing facts, where they are explaining relationships, and where they need a prompt to check the reasoning behind each link.
Thinking Maps are visual tools that help learners organise ideas around a clear thinking process. These graphic organisers give the class a visible structure for links such as comparison, sequence, cause and effect, or part and whole. This means learners can discuss the reasoning instead of trying to hold every idea in memory.
Learners can use visual tools across subjects and year groups. Visual methods can support early literacy and speech, as well as thinking maps. These maps help learners think in creative, critical, and analytical ways. Teachers also use them to develop higher-order thinking for learners of all abilities.
Thinking maps simplify complex ideas into visual patterns. This makes learning easier for some learners. Visual aids can support those who find text difficult.
These tools also work well for developing higher-order thinking skills. Learners learn to analyse, evaluate, and create through structured visual activities. The spatial organisation helps them engage in clear reasoning as they work through their ideas.
Thinking Maps support disciplined idea generation when learners explain the links between concepts, values and evidence (Hyerle, 2009). To avoid shallow "string maps", ask learners to write precise linking words and add cross-links between different parts of the map (Novak & Cañas, 2008).
Thinking Maps can help teachers make scientific reasoning visible. In a forces lesson, learners might use a Flow Map to sequence an investigation, then add evidence beside each stage to show how the data supports or challenges a hypothesis.
Mind maps help learners understand complex ideas like ethics (Novak, 1998). They see decision rationales and think critically (Buzan, 2006). The visual style reveals patterns and core principles (Ausubel, 1960). Learners look past simple observations with mind maps.
Structural Learning's website offers free accounts. Teachers can access diverse graphic organisers there. These visual tools support learning (Jonassen et al., 2008; Novak, 1998; Hyerle, 1996).
Researchers Hyerle and Yeatts (2008) found thinking maps aid learning school-wide. Systematic use boosts cognitive processes for grasping complex ideas. Teachers can use these patterns to help every learner access thinking skills tools.
These visual tools also support metacognitive monitoring. Brown (1987) argued that learners need to plan, monitor and regulate their thinking; a completed map gives teachers and learners a visible record of assumptions, gaps and connections that can be questioned during feedback.
There is rarely one finished version of a useful map. Two learners may map the same topic differently because they notice different relationships, sources or examples. This flexibility is useful only when the teacher asks them to explain the choices behind the map.
When learners use Thinking Maps well, they can turn abstract concepts into concrete relationships. A Year 8 science class might use a Multi-Flow Map to separate the causes and effects of coastal erosion, then add linking words such as "increases", "weakens" and "results in". This supports deeper learning because the map records the reasoning, not just the topic vocabulary.
Learners need repeated practice before a map becomes a thinking tool. Start with teacher modelling, move to guided pairs, then ask learners to choose and justify the map that best fits the task.
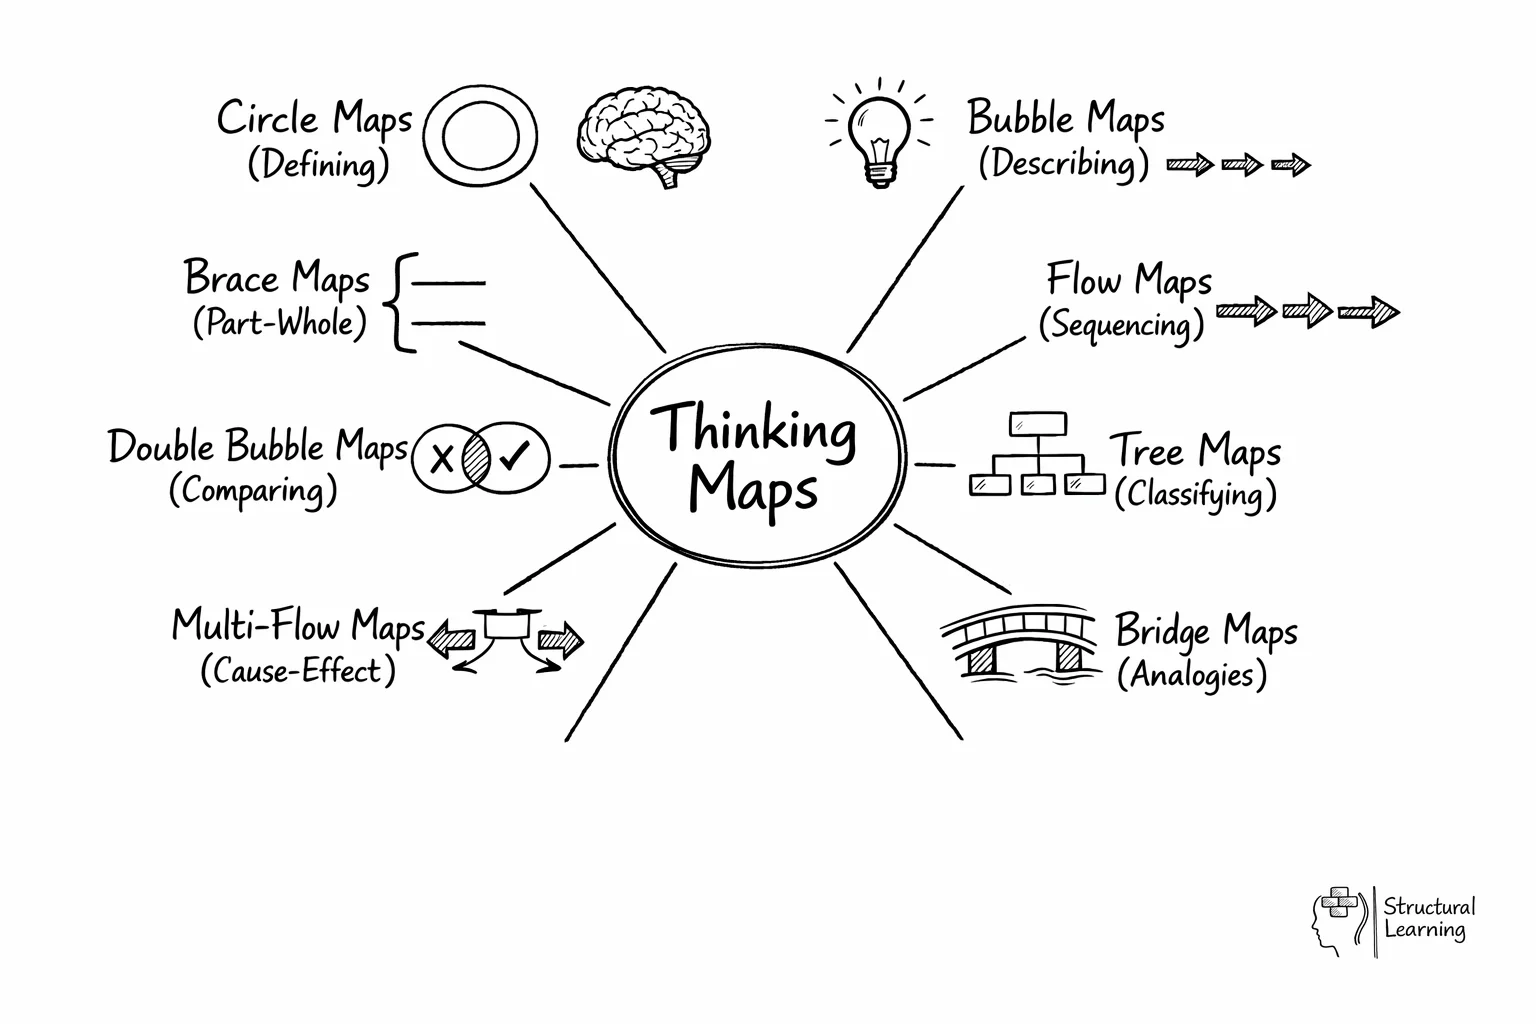
Thinking Maps are a proprietary set of eight visual patterns, each linked to a thinking process. Circle Maps define; Bubble Maps describe; Flow Maps sequence; Brace Maps show part-whole links; Tree Maps classify; Double Bubble Maps compare; Multi-Flow Maps show cause and effect; Bridge Maps show analogies. This matters because concept maps, mind maps and argument maps are not interchangeable: Davies (2011) shows that each tool makes different claims about knowledge structure, association and reasoning. Teachers should choose the map that fits the cognitive task, not the most familiar template.
Thinking maps are organised into eight different types. Each type connects a specific cognitive skill with a visual pattern, similar to how mind map techniques work but with more structured frameworks.
Teachers should choose the thinking map that best fits the task. This helps learners to select the thinking processes that will help them achieve success. By systematically matching cognitive tasks to visual tools, teachers can create a classroom environment that actively cultivates critical thinking.
Thinking Maps work best as taught routines, not as decorative worksheets. Introduce one map at a time, model the thinking process aloud, then ask learners to justify why a particular map fits the task:
Integrating maps gives all learners a shared visual language. This consistency helps learners understand thinking processes better. (Novak, 1998; Buzan, 2006; Hyerle, 2009).
Thinking Maps can support independent learning when teachers first model examples, then give learners more choice. Be careful about saying that the branded programme alone improves comprehension. The evidence is stronger for graphic organisers and concept mapping in general than for separate Thinking Maps studies (Hyerle, 2009; Novak & Cañas, 2008).
The evidence is stronger for graphic organisers and concept mapping as broad teaching strategies than for the proprietary Thinking Maps programme on its own. Hattie (2009) reports a positive effect for concept mapping. Teachers should see this as related evidence, not proof that every branded map or worksheet improves attainment. Hyerle (2009) gives the main account of the programme, while independent classroom evaluation is still thinner.
Sweller (1988) showed that working memory is limited during problem solving, but his 1988 paper did not test Thinking Maps directly. A safer classroom claim is that well-designed maps can reduce extraneous load, which is extra mental effort that does not help learning. They do this when they reduce split attention and make relationships easy to inspect. Poorly designed maps can add load if learners spend more effort decoding the format than learning the content (Chandler & Sweller, 1991; Ainsworth, 2006; Mayer, 2009).
Novak and Cañas (2008) separate concept maps from loose webs. In strong maps, learners name the link between ideas and add cross-links between knowledge segments. Ausubel's theory of meaningful learning is also useful here: learners retain new knowledge when they connect it to existing cognitive structures (Ausubel, 1968). Structural Learning applies this principle in classroom tools, while Merrill's First Principles of Instruction gives a separate design lens for problem-centred teaching (Merrill, 2002).
Dual coding theory (Paivio, 1986) helps explain why this works. When learners process information through words and images, they build stronger memory traces than with words alone.
For example, a learner may read about cause and effect and then draw a Multi-Flow Map. This encodes the concept twice. When they meet it again, they have two retrieval routes, which makes learning more durable and more transferable.
For writing, the safer claim is practical rather than statistical. A Flow Map can help learners sequence ideas before drafting, while a Tree Map can help them group evidence before paragraph writing. The gain comes from reducing planning confusion and making relationships explicit, not from the map itself guaranteeing longer or better writing.
The power of Thinking Maps increases when they become a shared language across the school. A learner who uses a Double Bubble Map in English to compare two characters uses the same structure in science to compare plant and animal cells, and in geography to compare urban and rural settlements. The thinking process transfers because the visual structure is consistent.
A Year 2 teacher introduces a new science topic on materials. She displays a Circle Map on the interactive whiteboard, with "Wood" in the centre circle. She asks: "What do we already know about wood?"
Learners contribute ideas: hard, brown, comes from trees, floats, can be cut. These ideas fill the outer circle as prior knowledge. Then she adds a second Circle Map for "Plastic", so the class can see similarities and differences before formal comparison begins.
In Year 4 literacy, learners use a Flow Map to plan a recount of a school trip. Its sequence helps them avoid the common pattern of "and then... and then... and then..." writing. Each box contains one event and a time connective.
The teacher models: "First, we arrived at the museum. Next, we explored the dinosaur gallery." Learners then use the map as a scaffold for independent writing. Once they know the structure well, the teacher can gradually remove the scaffold.
A Year 1 teacher uses a Brace Map for a mathematics lesson on partitioning numbers. The number 7 sits on the left. To the right, it branches into 5 and 2, then 4 and 3, then 6 and 1.
Learners can see the different ways to break down one number in a single visual representation. This concrete, visual approach supports the move from manipulatives to abstract number work.
Learners use a Multi-Flow Map to analyse the causes and effects of deforestation. Tropical Deforestation sits in the centre. Logging and farming are causes on the left, while habitat loss and soil erosion are effects on the right.
Learners then connect habitat loss to species extinction and soil erosion to flooding. The map shows these consequences more clearly than text alone.
Year 11 learners can compare Macbeth and Lady Macbeth using Double Bubble Maps. Shared bubbles might record ambition, guilt and reliance on persuasion, while separate bubbles distinguish Macbeth's hesitation from Lady Macbeth's early decisiveness. The teacher should then ask learners to turn one shared or contrasting point into a paragraph, using textual evidence rather than treating the map as the finished analysis.
Year 8 RE uses Bridge Maps for ethical reasoning. "Doctor to patient" relates like "teacher to learner" through duty of care. Learners create analogies (parent/child, government/citizens). This activity builds abstract thought, Bloom's (1956) highest cognition level.
Thinking Maps deliver their greatest impact when adopted consistently across a school. Hyerle (2009) found that whole-school implementation produced effect sizes three times larger than individual classroom use. The reason: learners develop automaticity with the visual language. They stop thinking about how to use the map and start thinking with the map.
Phase 1: Staff training (one INSET day). All teachers learn the eight maps and their cognitive purposes. Each teacher identifies two maps they will introduce in their first half-term. The training includes worked examples from every subject area so that no teacher leaves thinking "this is just for English."
Phase 2: Consistent display (first half-term). Every classroom displays the same reference poster showing all eight maps with their names and purposes. Learners begin to recognise the maps as a shared vocabulary. A learner moving from a maths lesson to a history lesson sees the same visual tools and transfers the thinking skills between contexts.
Phase 3: Learner choice (second half-term). Once learners know all eight maps, shift the responsibility to them. Ask: "Which thinking map would help you organise your ideas for this task?" This is the metacognitive goal.
Learners are not just using the maps. They are choosing the right cognitive tool for the task. To do this, they must analyse the thinking demand before they start, which builds the strategic metacognitive awareness seen in independent learners.
Phase 4: Assessment and curriculum review. Departments can use Thinking Maps as evidence of reasoning in selected assessments. Leaders can also sample maps across subjects to check whether the curriculum is sequenced coherently: repeated gaps, weak links or confused categories may show where teachers need subject CPD or where departments use different language for the same concept.
Map creation and map critique. Digital whiteboards and AI tools can make a spatial organiser in seconds. So the main task should shift from drawing boxes to judging the logic.
Ask learners to check the structure, the link labels and any missing evidence. They should also ask whether another map would show the concept more accurately. This makes the task a form of metacognitive monitoring, not just neat note-making.
Thinking Maps can help some learners with SEND because the visual structure reduces the amount of information held in working memory. They can also create barriers if the layout is too rigid, crowded or dependent on colour alone. Offer tactile cards, oral explanation, screen-reader friendly text and learner choice of layout when the standard map does not fit how a learner organises knowledge (CAST, 2018).
At what age can learners start using Thinking Maps? Reception and Year 1 learners can use Circle Maps (defining) and Bubble Maps (describing) with support. By Year 2, most learners can use Flow Maps (sequencing) and Tree Maps (classifying) independently.
The full set of eight maps is typically accessible by Year 4. Younger learners benefit from physical, manipulative versions, such as large maps on the floor with cards they can move and rearrange before they put ideas on paper.
Free for teachers. The platform builds a classroom-ready lesson plan from your topic in under two minutes.
Thinking maps are eight specific visual frameworks designed to mirror fundamental cognitive processes. Each map uses a distinct pattern to help learners organise their thoughts and make abstract concepts more concrete. These tools provide a consistent visual language that learners can apply across all subjects and year groups.
Teachers begin by introducing each of the eight maps as a specific tool for a certain type of thinking, such as sequencing or classifying. Once learners recognise the patterns, they can use them independently to plan writing or solve complex problems. For best results, schools should use these tools systematically across all departments to create a shared cognitive language.
Visual tools reduce cognitive load, turning complexity into patterns. Learners connect ideas easier and think more deeply, (Schnotz & Kürschner, 2008). Visuals help struggling learners access content through structured entry points (Clark & Paivio, 1991; Mayer, 2009).
Research suggests that visual organisers help learners remember and understand ideas. Paivio (1971) showed that dual coding, which means using text and visuals together, helps learners process information. Mayer (2009) and Clark & Paivio (1991) found that these tools can also build metacognitive skills and independence.
While mind maps are often free-form webs for brainstorming, thinking maps are a set of eight structured frameworks each tied to a specific mental process. A mind map might be used for initial ideas, but a thinking map like a Flow Map is used specifically for sequencing events. This structure ensures that learners are practising specific cognitive skills rather than just recording information.
A common error is using a map that does not match the required cognitive task, such as using a Bubble Map for sequencing instead of a Flow Map. Teachers should also avoid using them as one-off activities rather than integrated tools for daily practice. It is essential to focus on the thinking process itself rather than just the appearance of the final diagram.
Start with one curriculum problem, not all eight maps. Choose a topic where learners often list facts without explaining relationships, such as causes of migration, properties of materials or character motivation. Model one map, require precise linking words, and ask learners to revise the map after feedback.
Used this way, Thinking Maps are not a shortcut to deeper learning. They are a visible record of reasoning that teachers can question, compare and improve. Their value depends on explicit teaching, careful design and regular movement from map completion to map critique.
Thinking Maps should not be treated as a guaranteed route to understanding. First, much of the strongest evidence applies to graphic organisers, concept maps or multimedia learning, not to the proprietary Thinking Maps programme itself. Hattie (2009) reports positive effects for concept mapping, but that does not prove that every branded map improves attainment in every subject.
Second, visual mapping can increase extraneous cognitive load. Sweller (1988) showed the limits of working memory, while Chandler and Sweller (1991) described split attention. If learners must decode a new map syntax, read crowded labels and track arrows at the same time, the map may compete with the content. Ainsworth (2006) makes a similar point: multiple representations help only when learners know what each representation contributes.
Third, maps can produce an illusion of understanding. Brown (1987) argued that metacognition involves monitoring and control, so a neat diagram is not enough. Novak and Cañas (2008) warn that weak linear string maps can show poor comprehension unless learners use precise linking words and cross-links.
There are also cultural and methodological limits. Rigid hierarchies may fit some Western school knowledge structures better than oral, relational or non-linear ways of organising knowledge. Colour-coded or dense visual layouts may also exclude some disabled or neurodivergent learners unless teachers provide accessible alternatives. Even with these cautions, Thinking Maps remain useful when teachers teach the reasoning behind the visual structure and treat the map as a prompt for explanation rather than as proof of learning.
Brown, A. (1987). Metacognition, executive control, self-regulation, and other more mysterious mechanisms.
Sweller, J. (1988). Cognitive load during problem solving.
These peer-reviewed studies form the evidence base for thinking maps and visual tools for learning and its classroom applications. Each paper offers practical insights for teachers seeking to ground their practice in research.
Visual Tools for Transforming Information Into Knowledge View study ↗
91 citations
David Hyerle (2009)
Hyerle's Thinking Maps are a visual language for eight thinking skills. Hyerle (2009) found school-wide use boosts reading, writing, and maths. Disadvantaged learners saw the biggest gains (Hyerle, 2009).
Multimedia Learning View study ↗
332 citations
Richard E. Mayer (2009)
Mayer (2009) showed learners understand better with words and visuals together. His theory explains that using graphic organisers helps learning. They lessen extra mental effort and engage both processing channels at once.
Mental Representations: A Dual Coding Approach View study ↗
1,809 citations
Allan Paivio (1986)
Paivio's (1971) dual coding theory says visual and verbal processing improves memory. Research shows learners remember more with visual mapping than plain text. This is true for all ages, according to Paivio (1971).
Cognitive Load During Problem Solving: Effects on Learning View study ↗
8,909 citations
John Sweller (1988)
Sweller's cognitive load theory (Sweller, date) shows thinking maps help learners. The maps show structure, lessening the working memory load. Learners use cognitive resources to understand the subject matter better. They are not creating and ordering ideas simultaneously.
Graphic Organizers: A Review of Scientifically Based Research View study ↗
29 citations
The Institute for the Advancement of Research in Education (2003)
Graphic organisers improve reading (Xin & Jitendra, 1999). They boost vocabulary and achievement across school (Dexter & Hughes, 2011). Consistent use and teaching learners to choose the right organiser shows the biggest effect (Ives, 2011; Kim et al., 2004; Zhang, 2018).
Dual-coded. Print-ready. Free for teachers.
Open a free account and help organise learners' thinking with evidence-based graphic organisers. Reduce cognitive load and guide schema building dynamically.