Find out how our metacognitive resources remove barriers to learning and add extra challenge to the curriculum.

A Venn diagram is a simple yet powerful tool for comparing and contrasting two or more subjects. This graphic organizer helps students identify similarities and differences, fostering critical thinking and analytical skills by organizing information into intersecting circles.
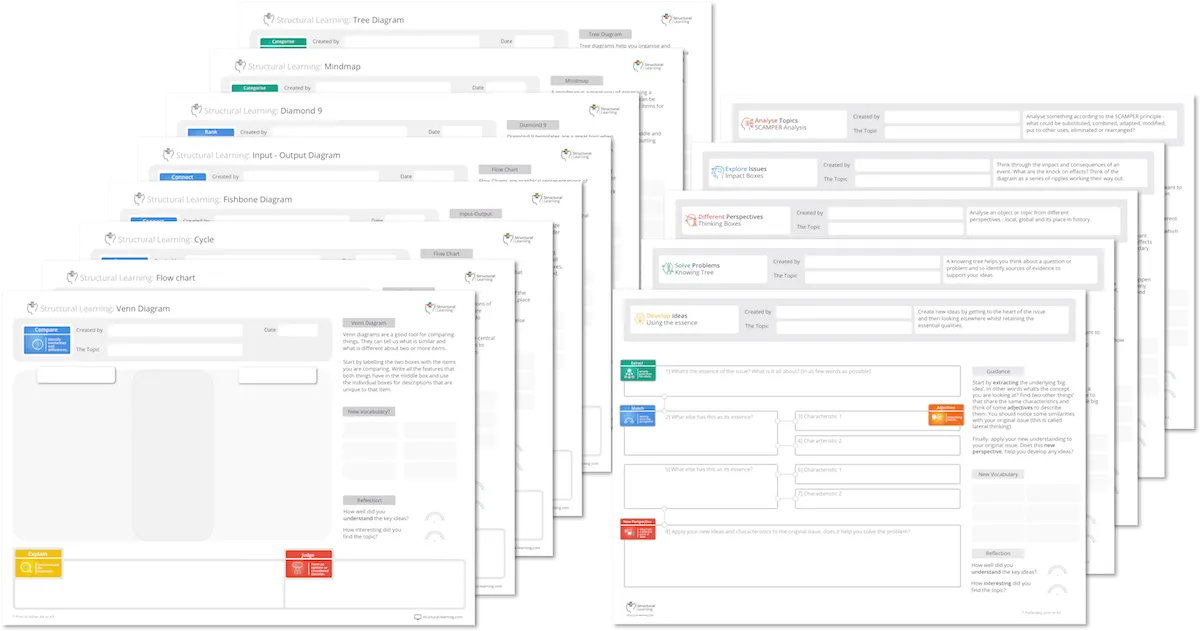
Tree diagrams help students break down broad topics into finer details through a branching method. This format supports organizational skills and helps in structuring written pieces or understanding complex hierarchies.
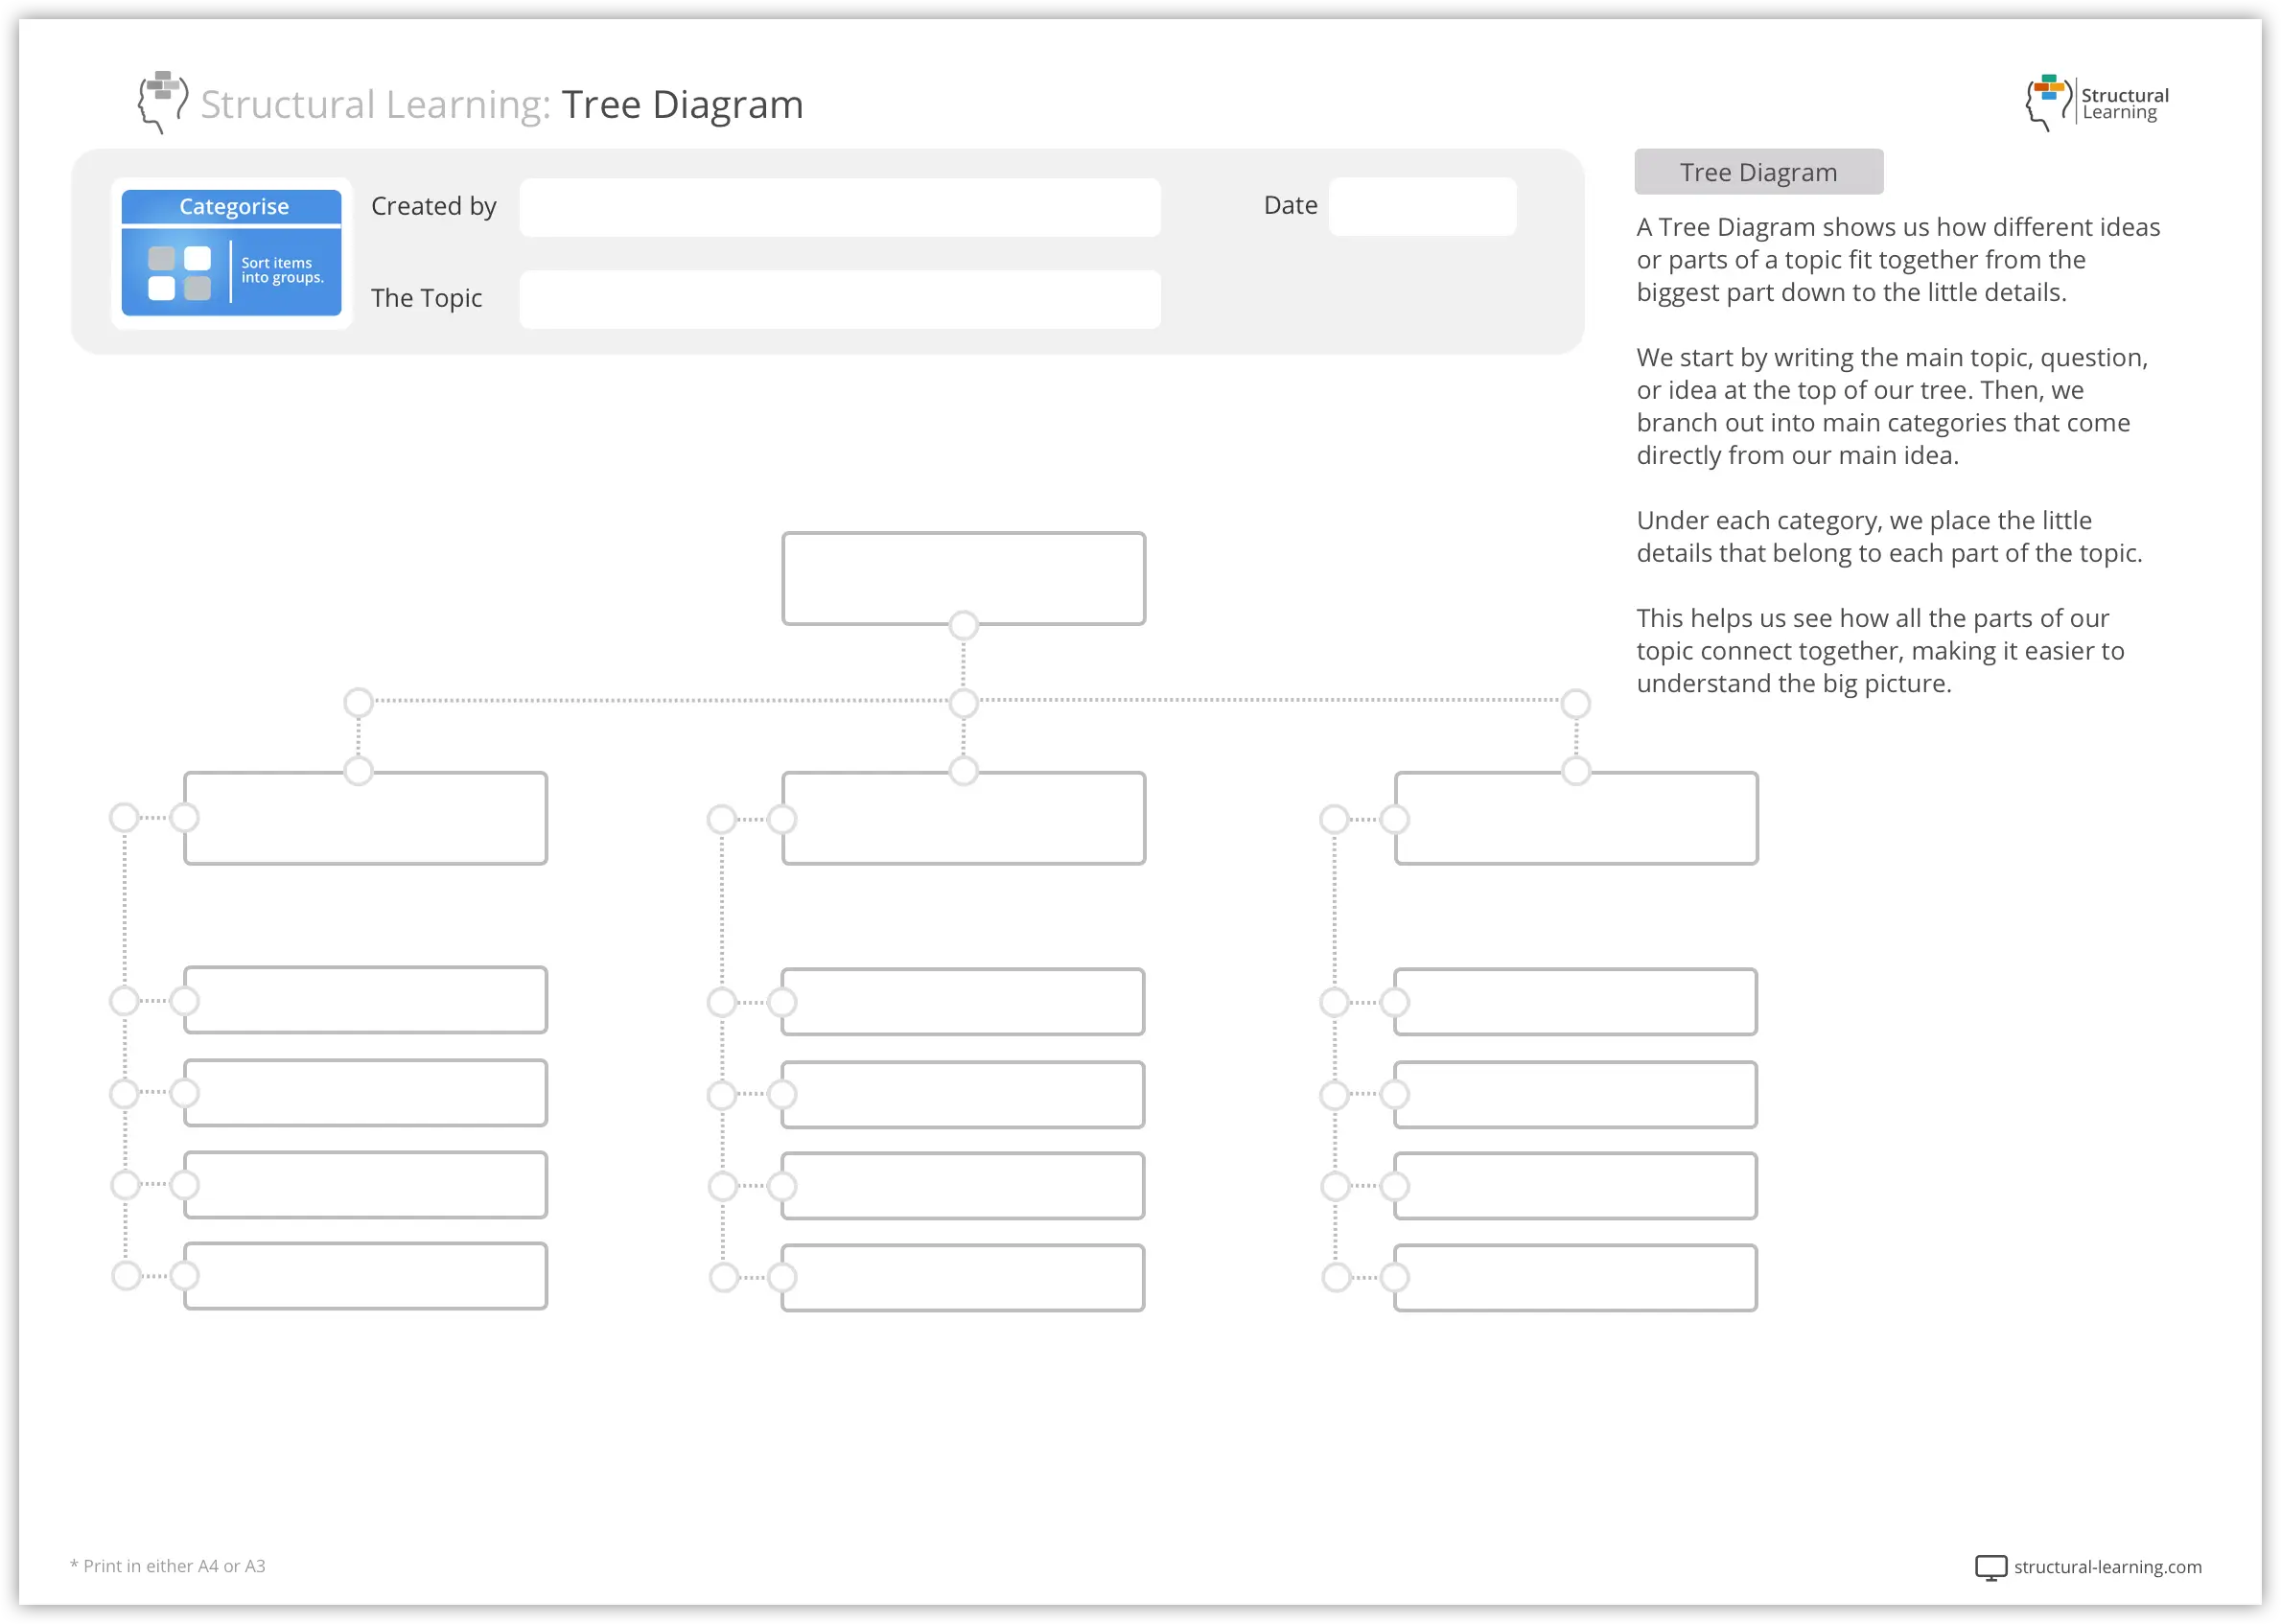
Input-output diagrams are excellent for exploring the causes and effects associated with a specific event. This organizer promotes understanding of input (causes) and output (effects), crucial for subjects like science and social studies.
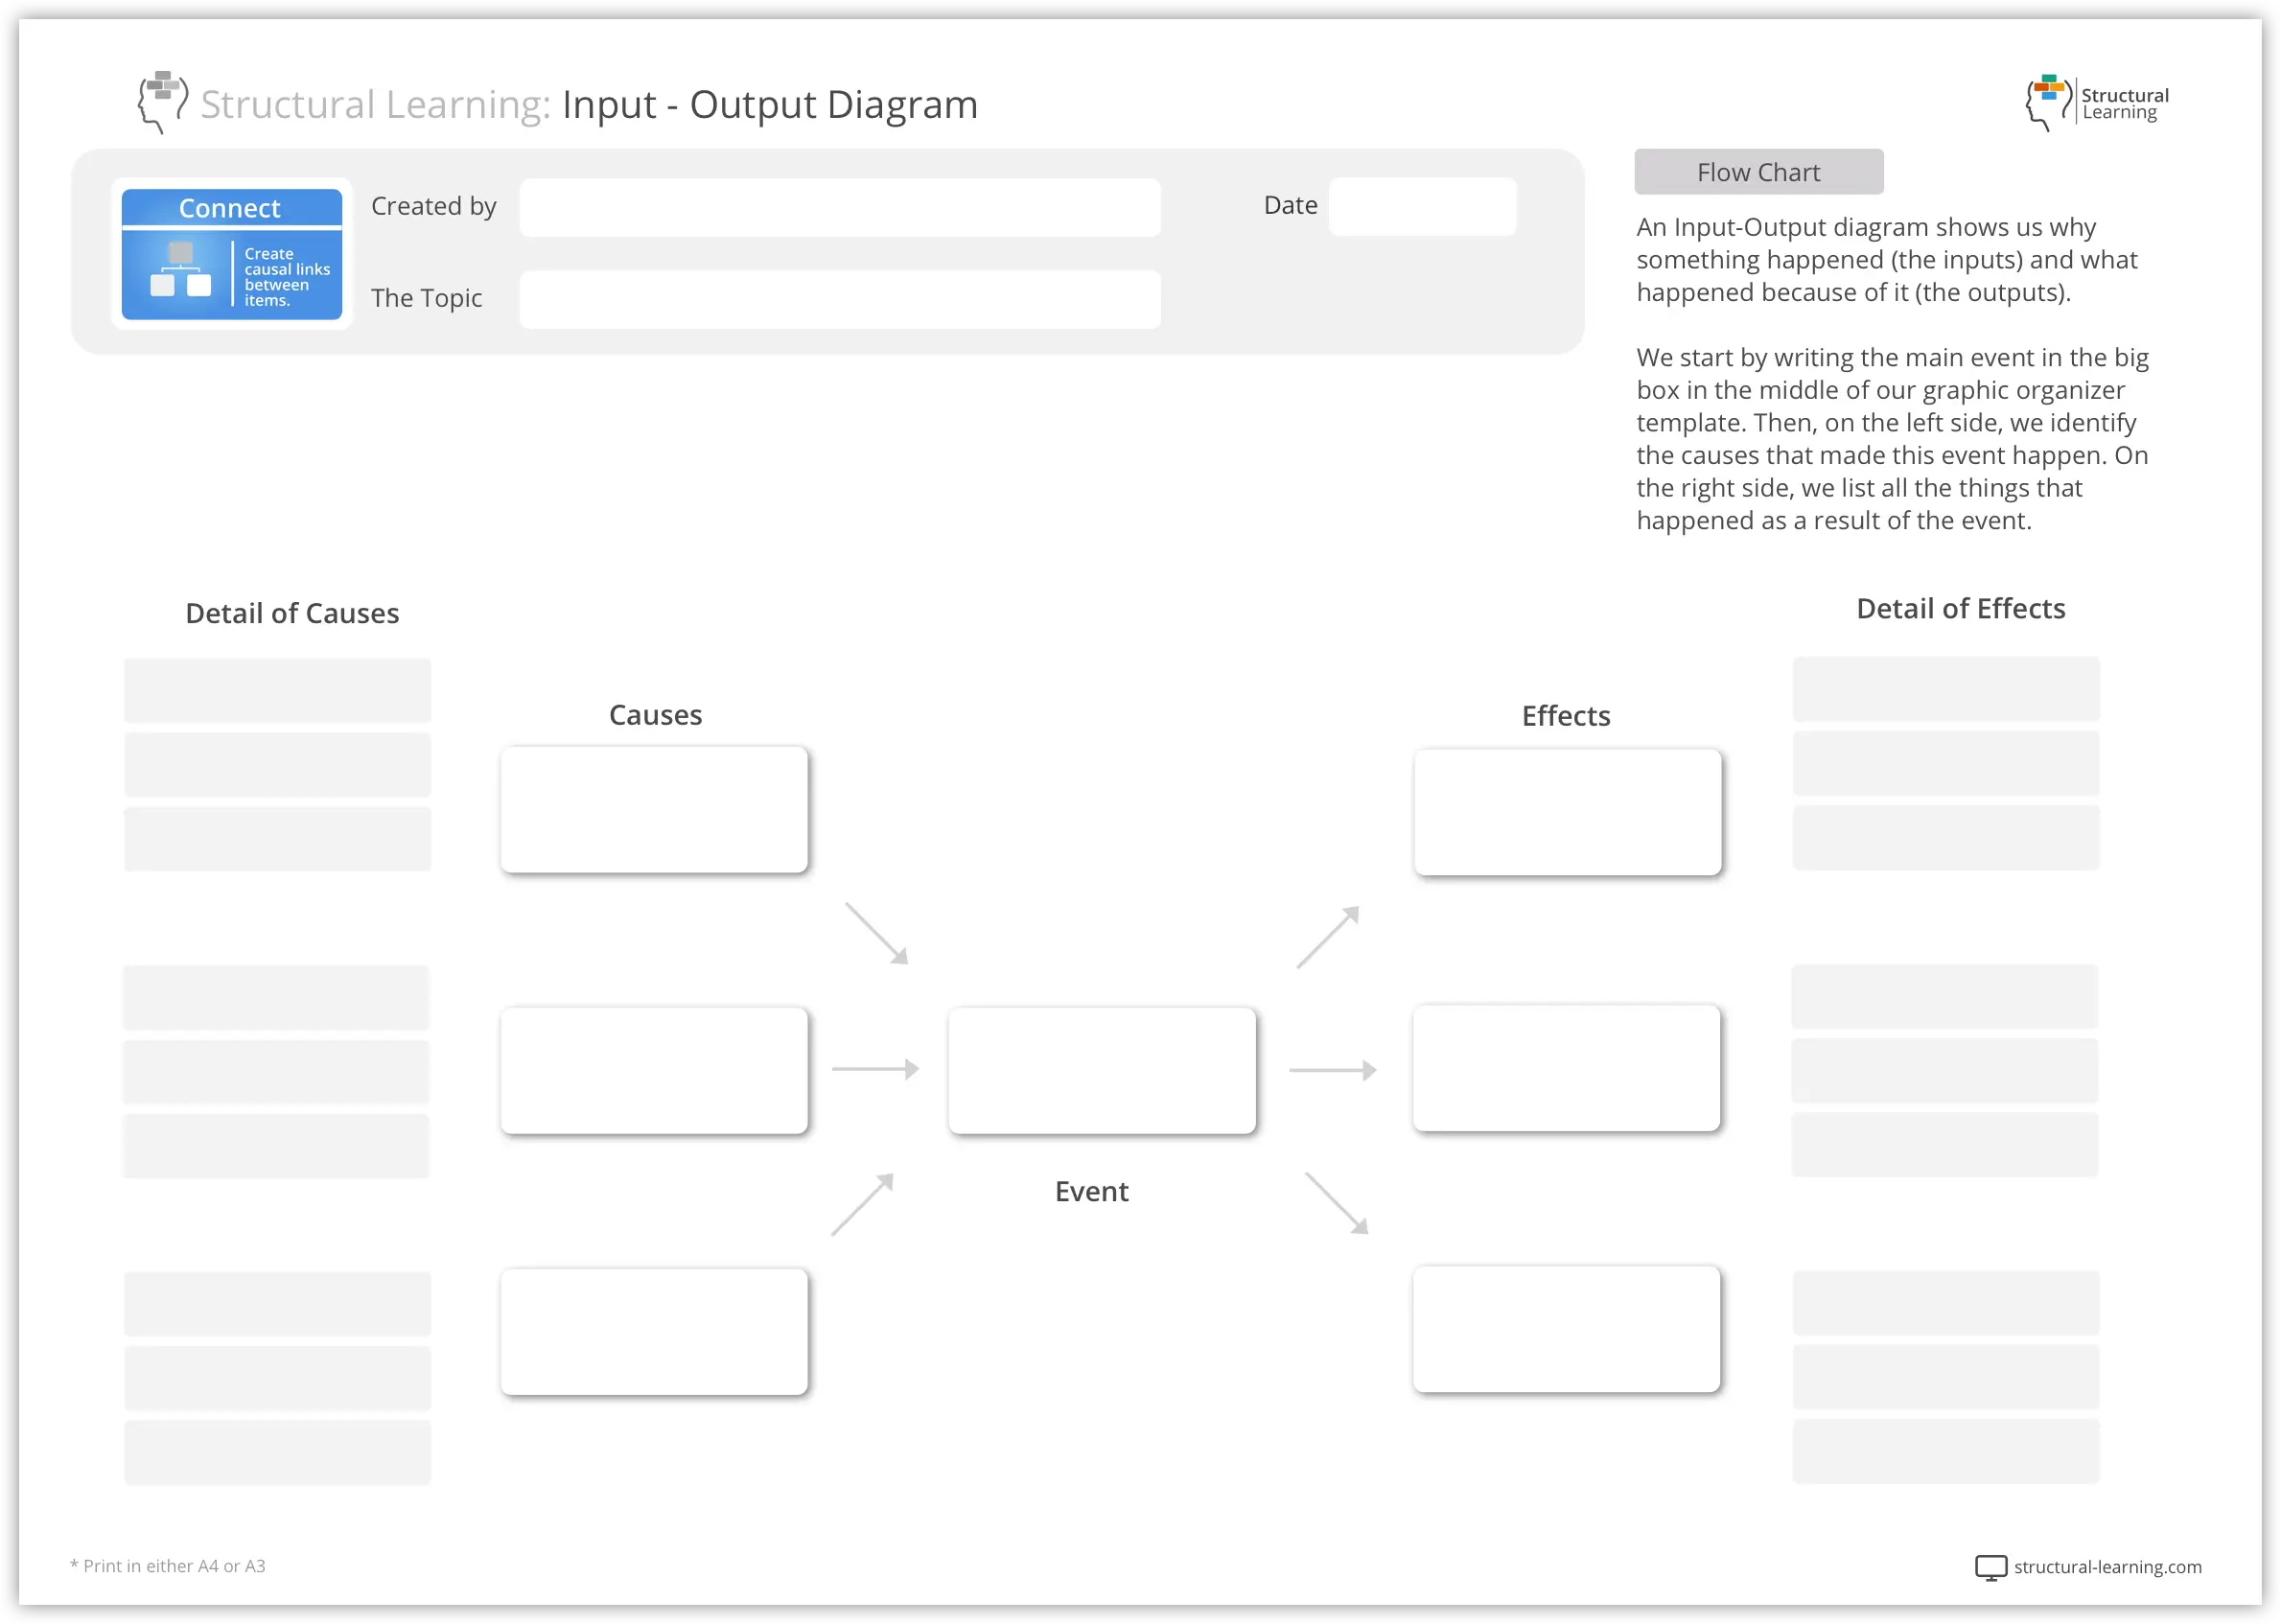
A flow chart is an effective visual tool for mapping out the steps in a process or the sequence of events. This graphic organizer assists young learners in visualizing the flow of activities or historical events, making it easier to grasp chronological relationships and process sequences.
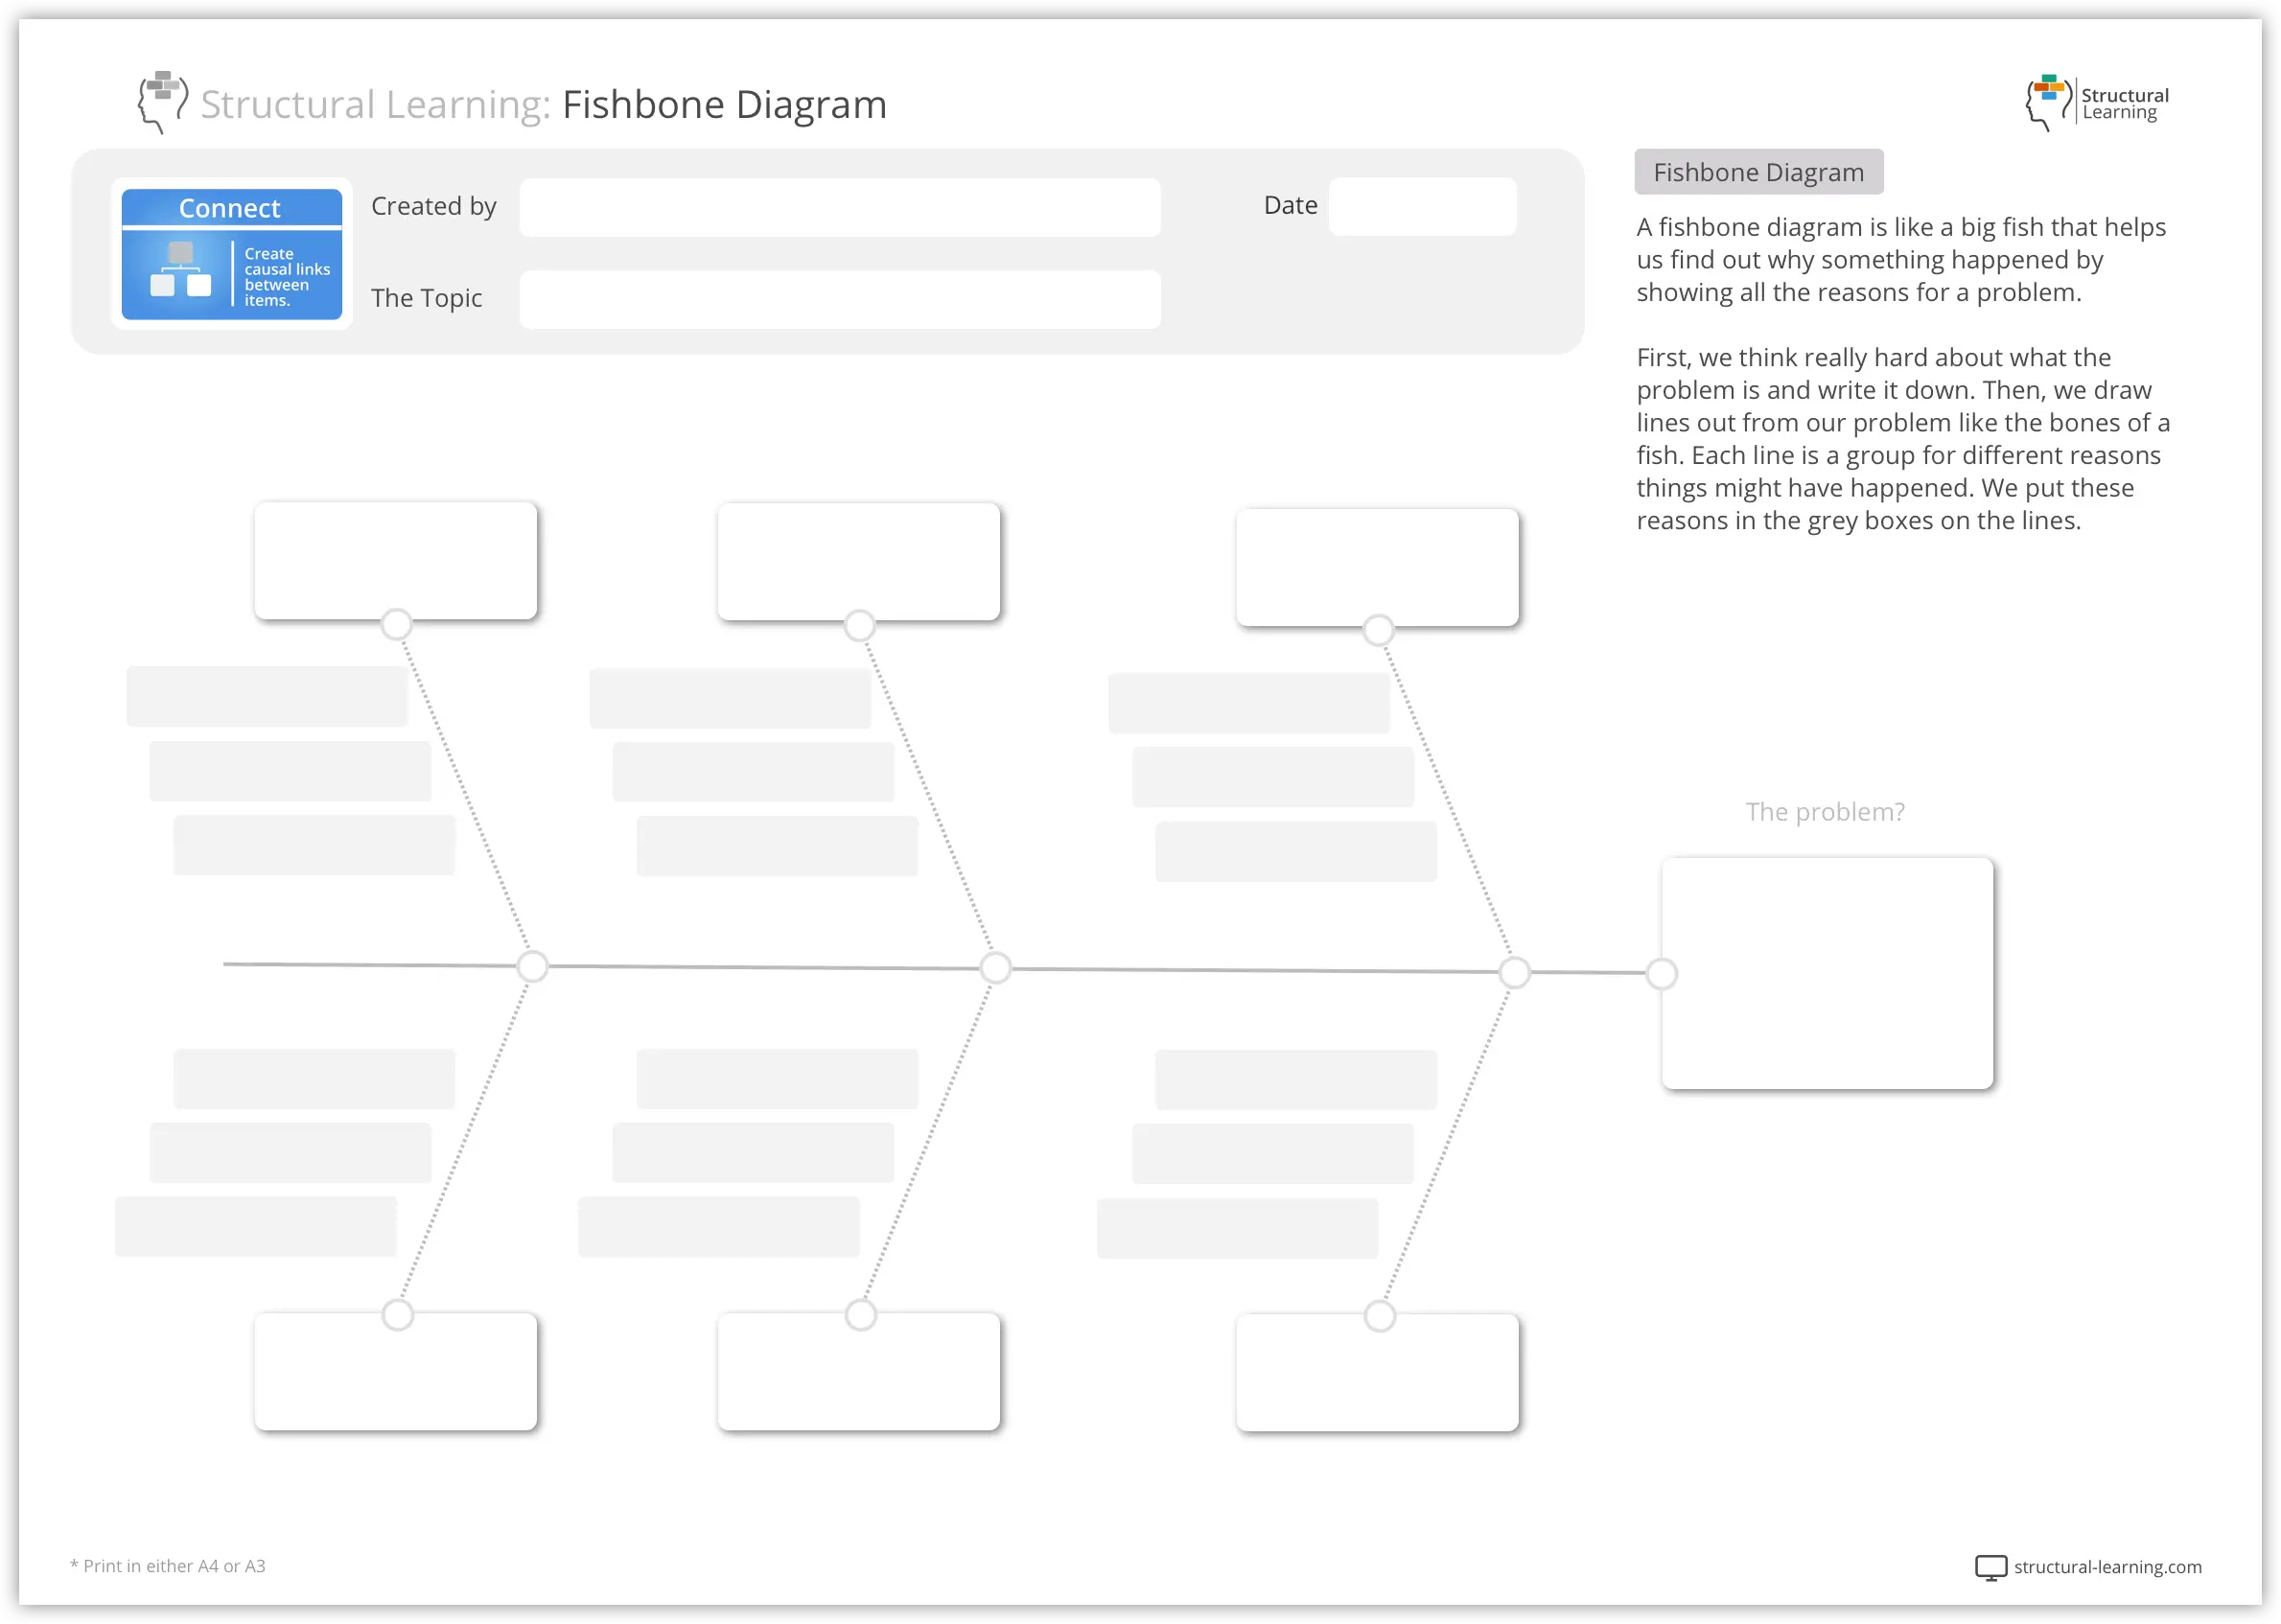
The fishbone diagram, or cause and effect organizer, is designed to help students visually map out the causes of a specific event. It’s an excellent way to explore complex interactions and develop reasoning skills by identifying multiple contributors to observed outcomes.

The Diamond 9 diagram is utilized to prioritize or rank ideas based on their importance. This tool encourages students to engage in evaluative thinking by arranging concepts in a diamond-shaped hierarchy, refining their decision-making skills.
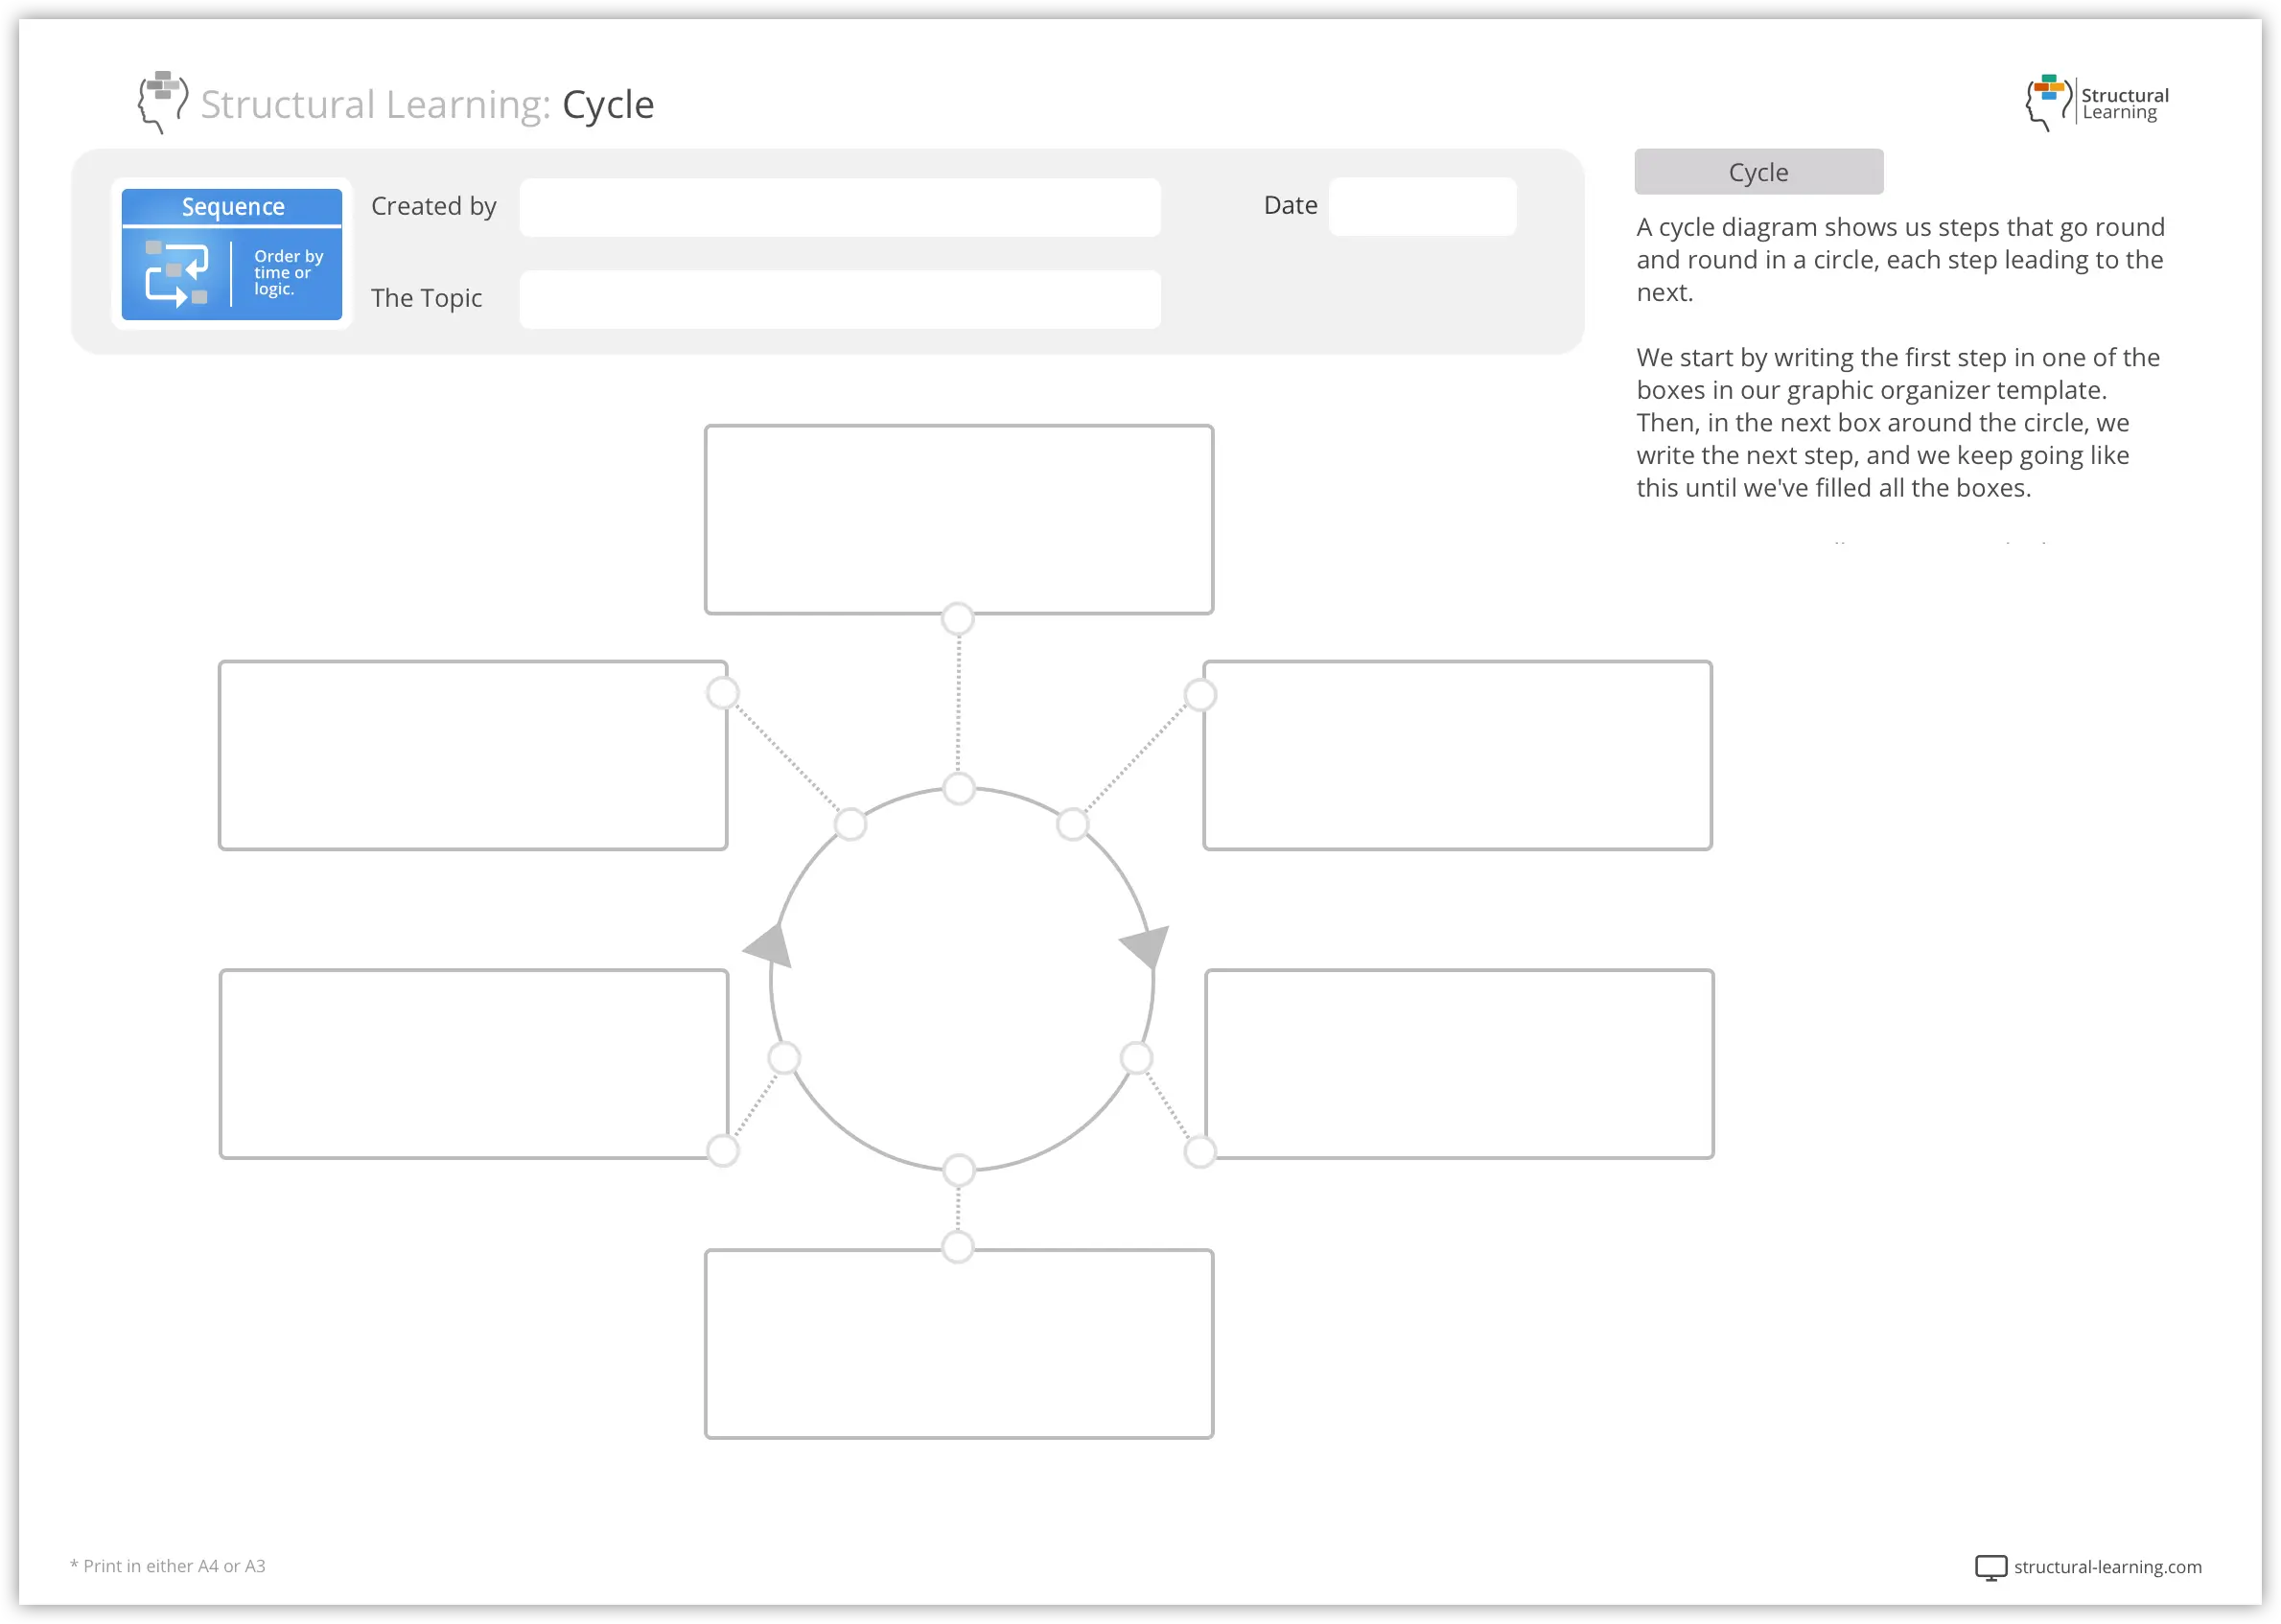
Cycle diagrams illustrate continuous processes or cycles, such as life cycles or cyclic patterns in nature. This organizer helps students understand and predict sequences of events, aiding in the comprehension of sciences and natural phenomena.
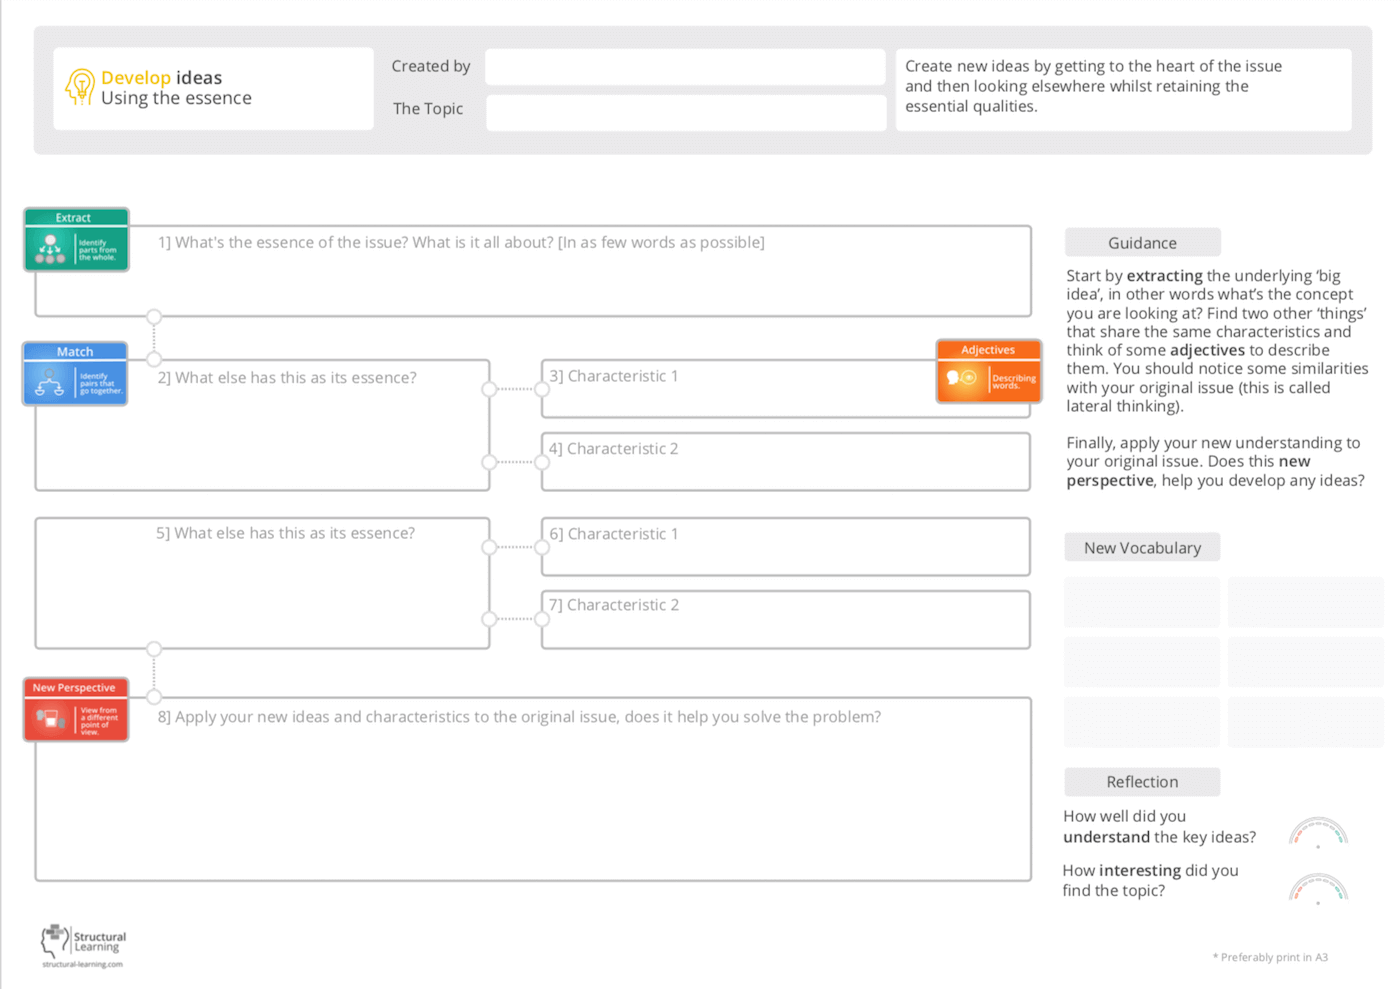
Create new ideas by getting to the heart of the issue and then looking elsewhere whilst retaining the essential qualities.
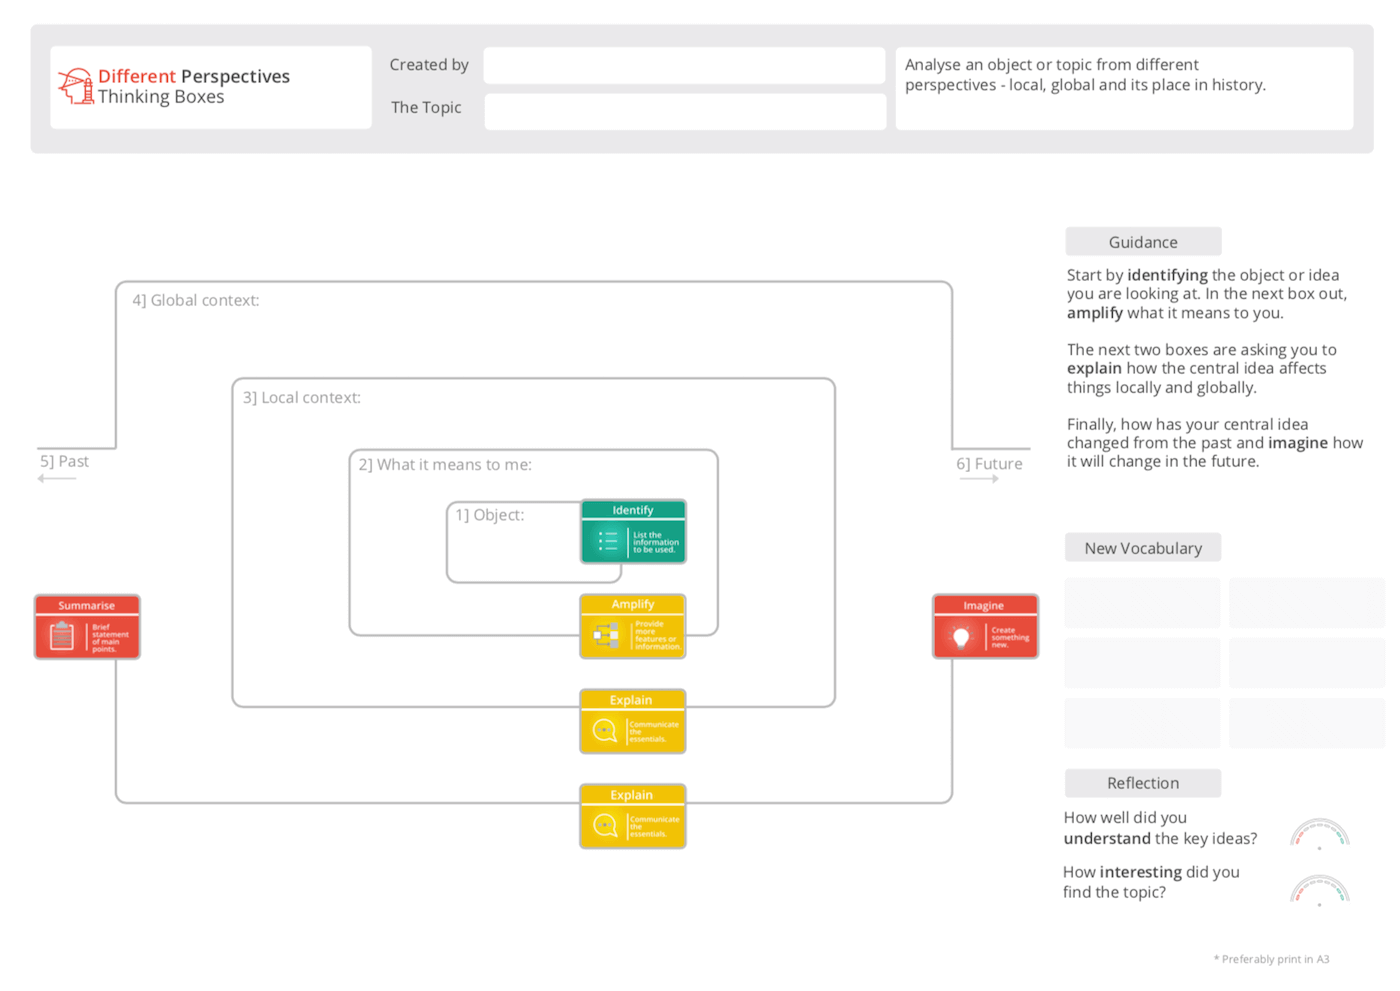
Analyse an object or topic from different perspectives - local, global and its place in history.
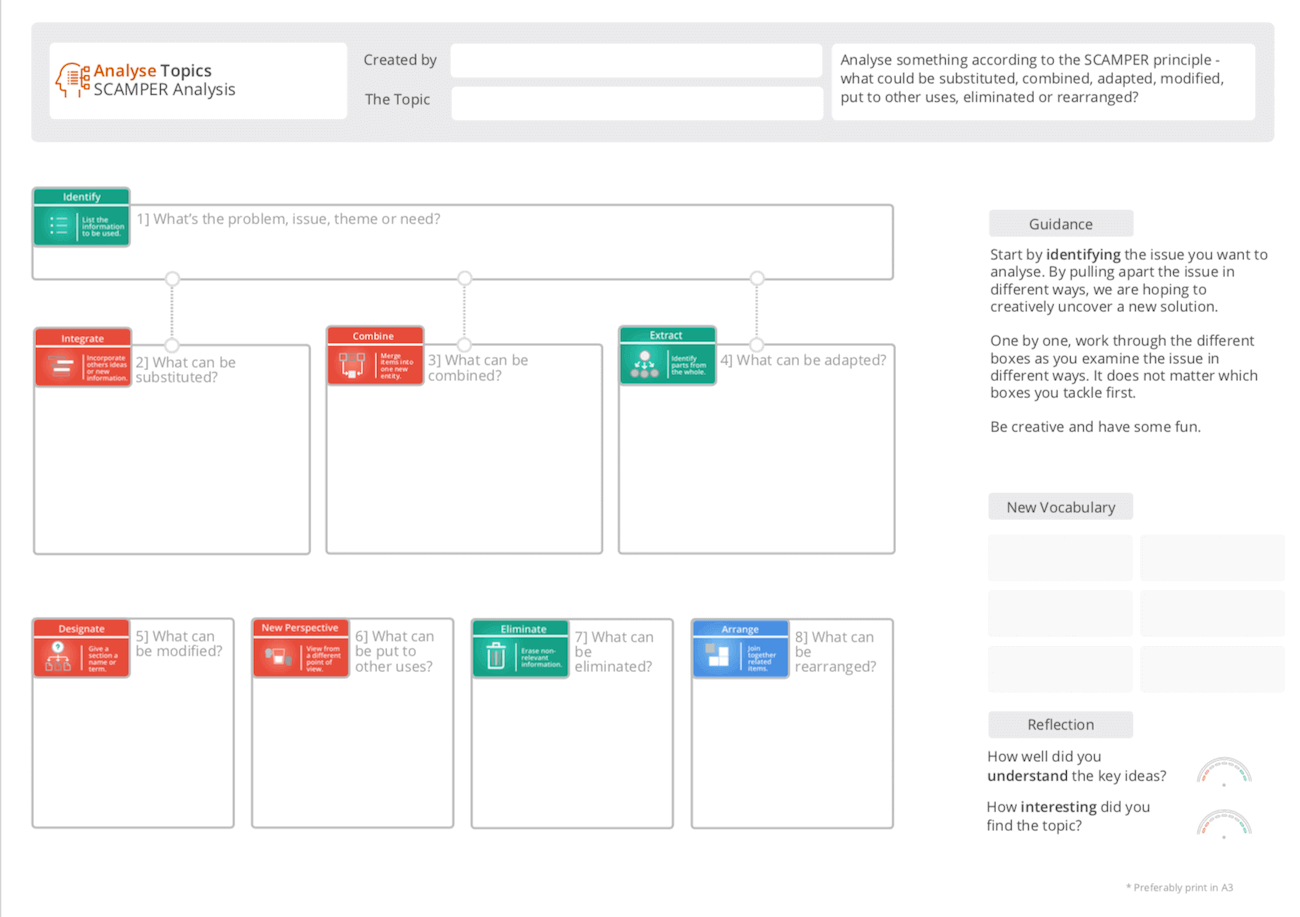
Analyse something according to the SCAMPER principle - what could be substituted, combined, adapted, modified, put to other uses, eliminated or rearranged?
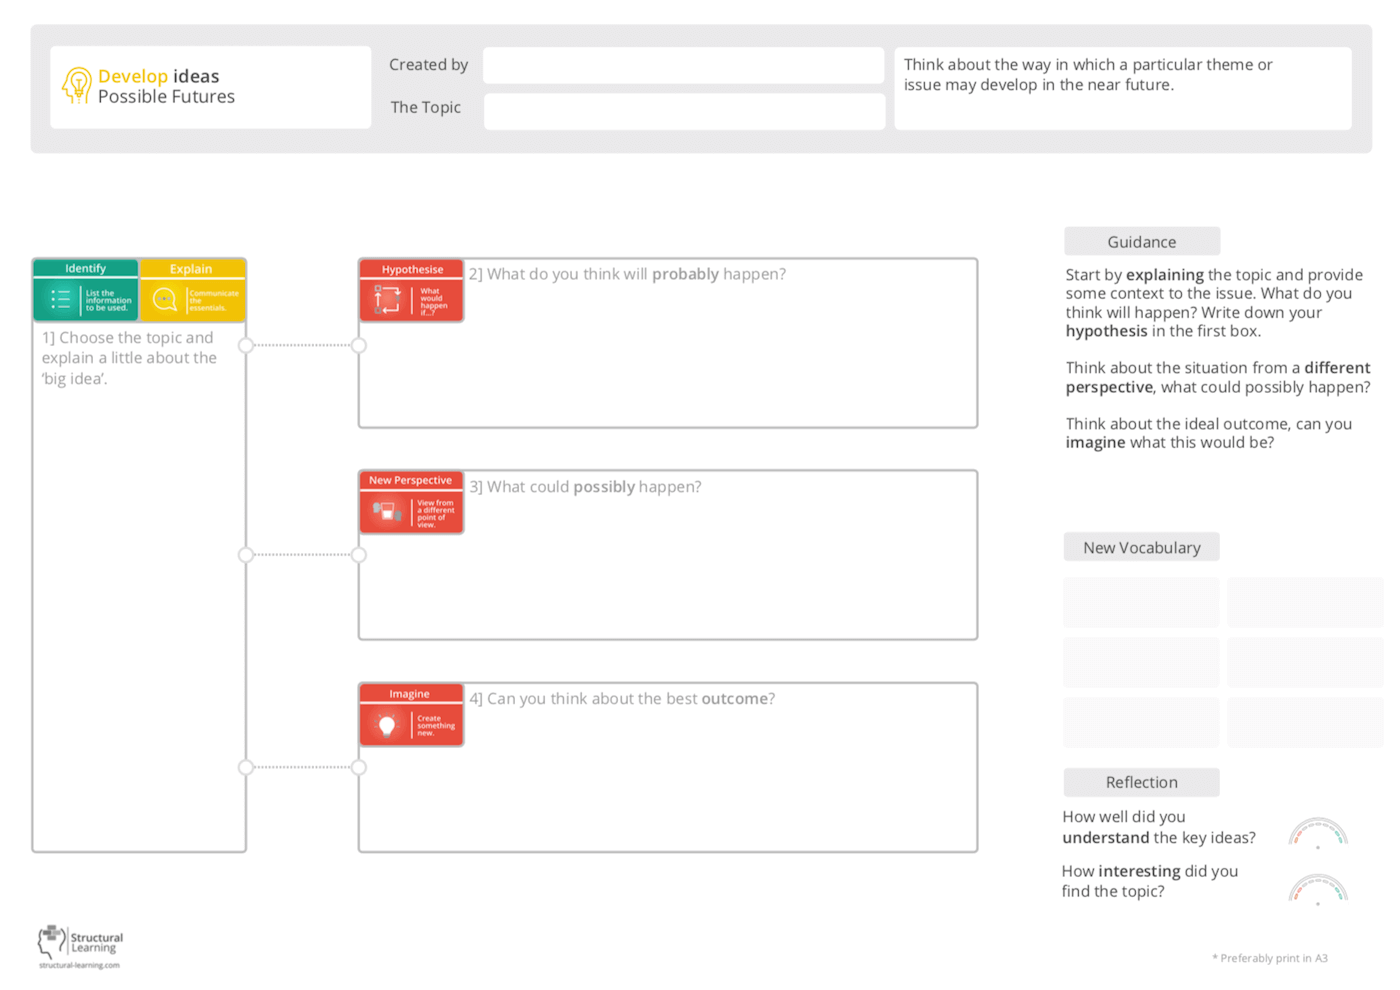
Think about the way in which a particular theme or issue may develop in the near future.

Think through the impact and consequences of an event. What are the knock-on effects? Think of the diagram as a series of ripples working their way out.
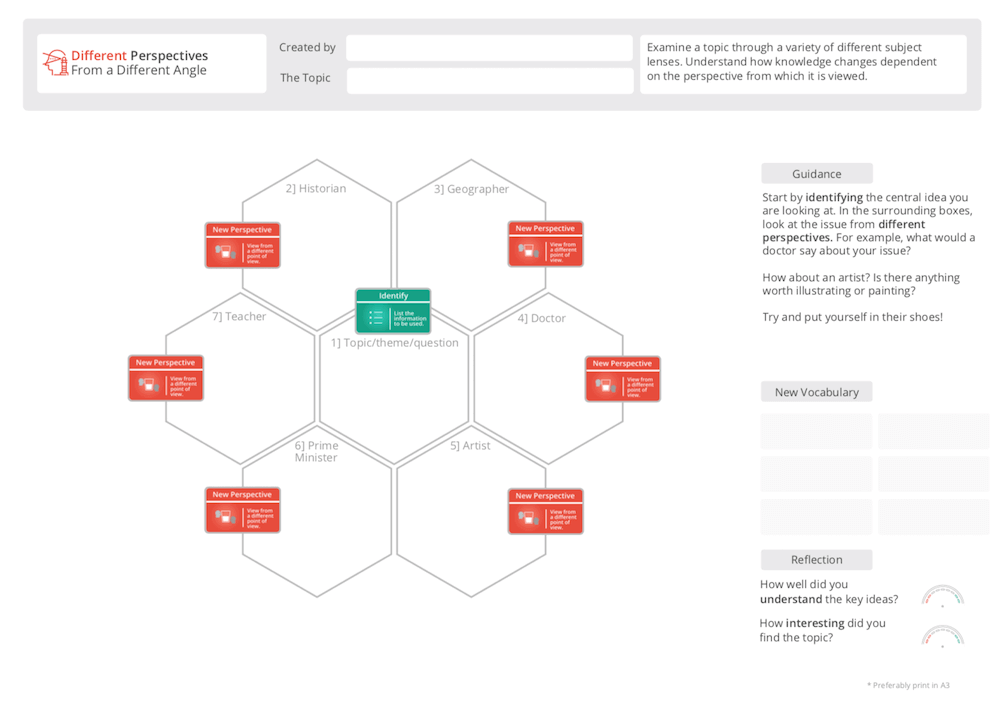
Examine a topic through a variety of different subject lenses. Understand how knowledge changes dependent on the perspective from which it is viewed.
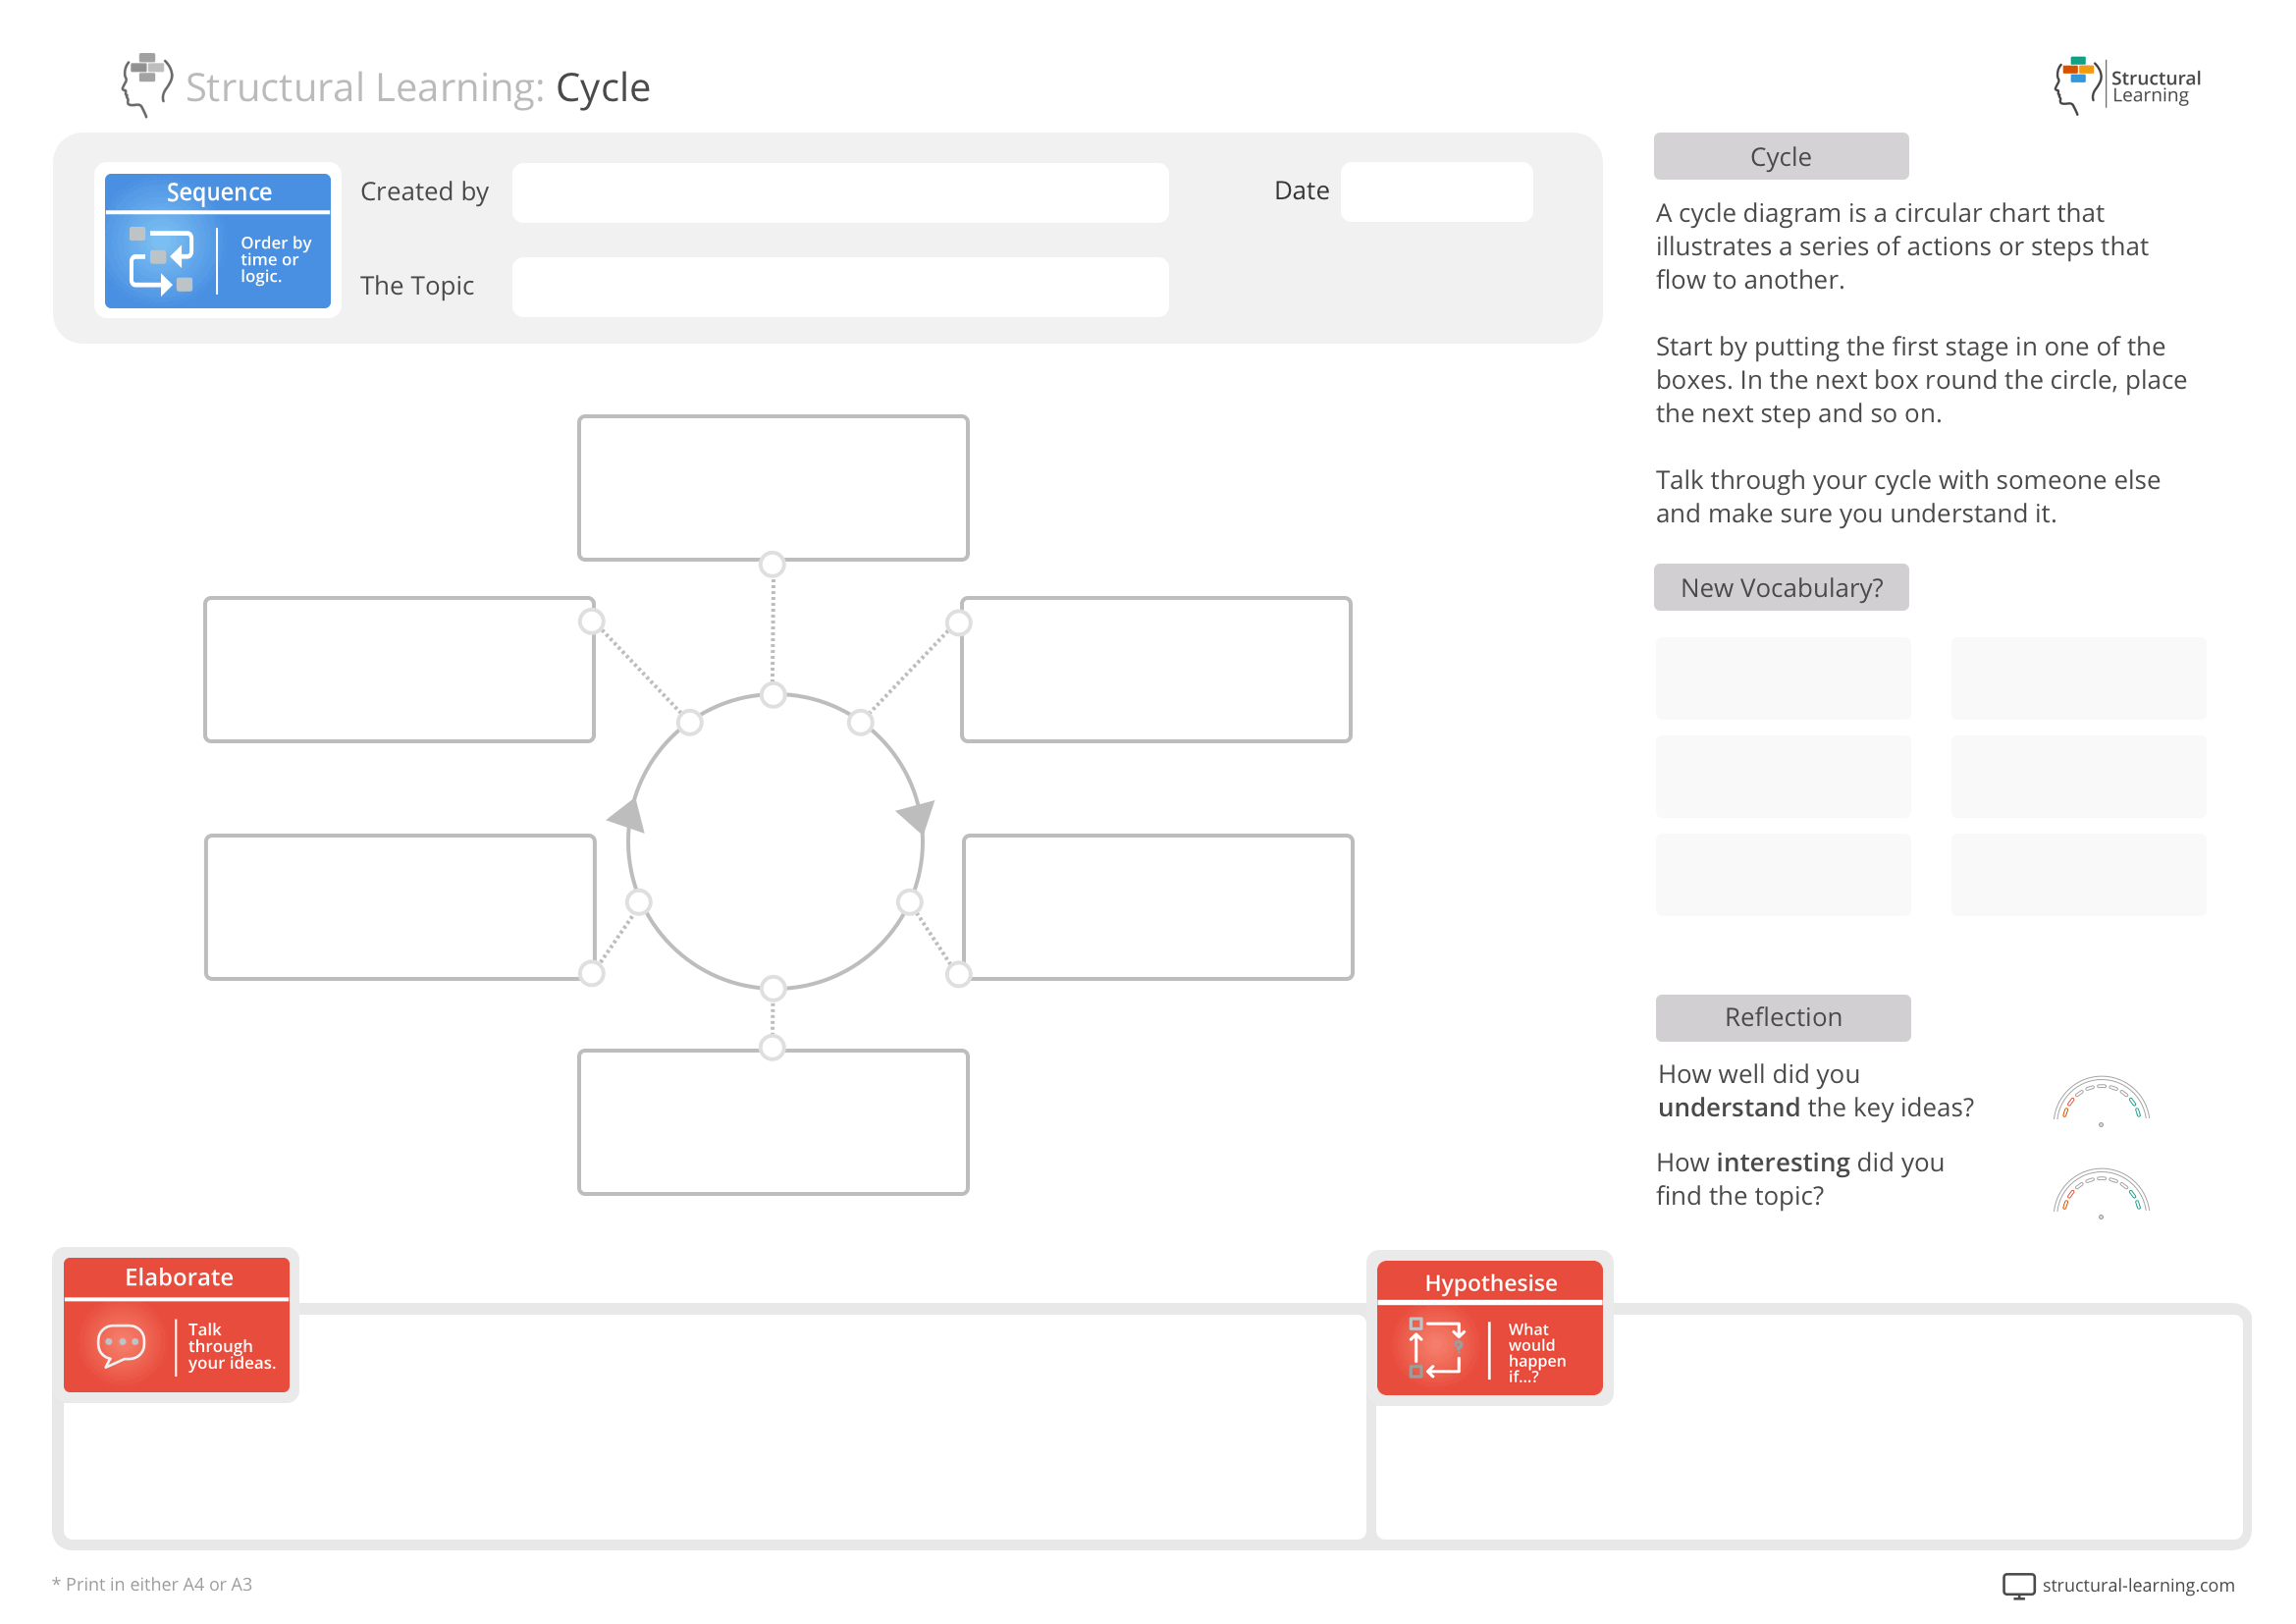
A cycle diagram is a circular chart that illustrates a series of actions or steps that flow to another. Start by putting the first stage in one of the boxes. In the next box round the circle, place the next step and so on.
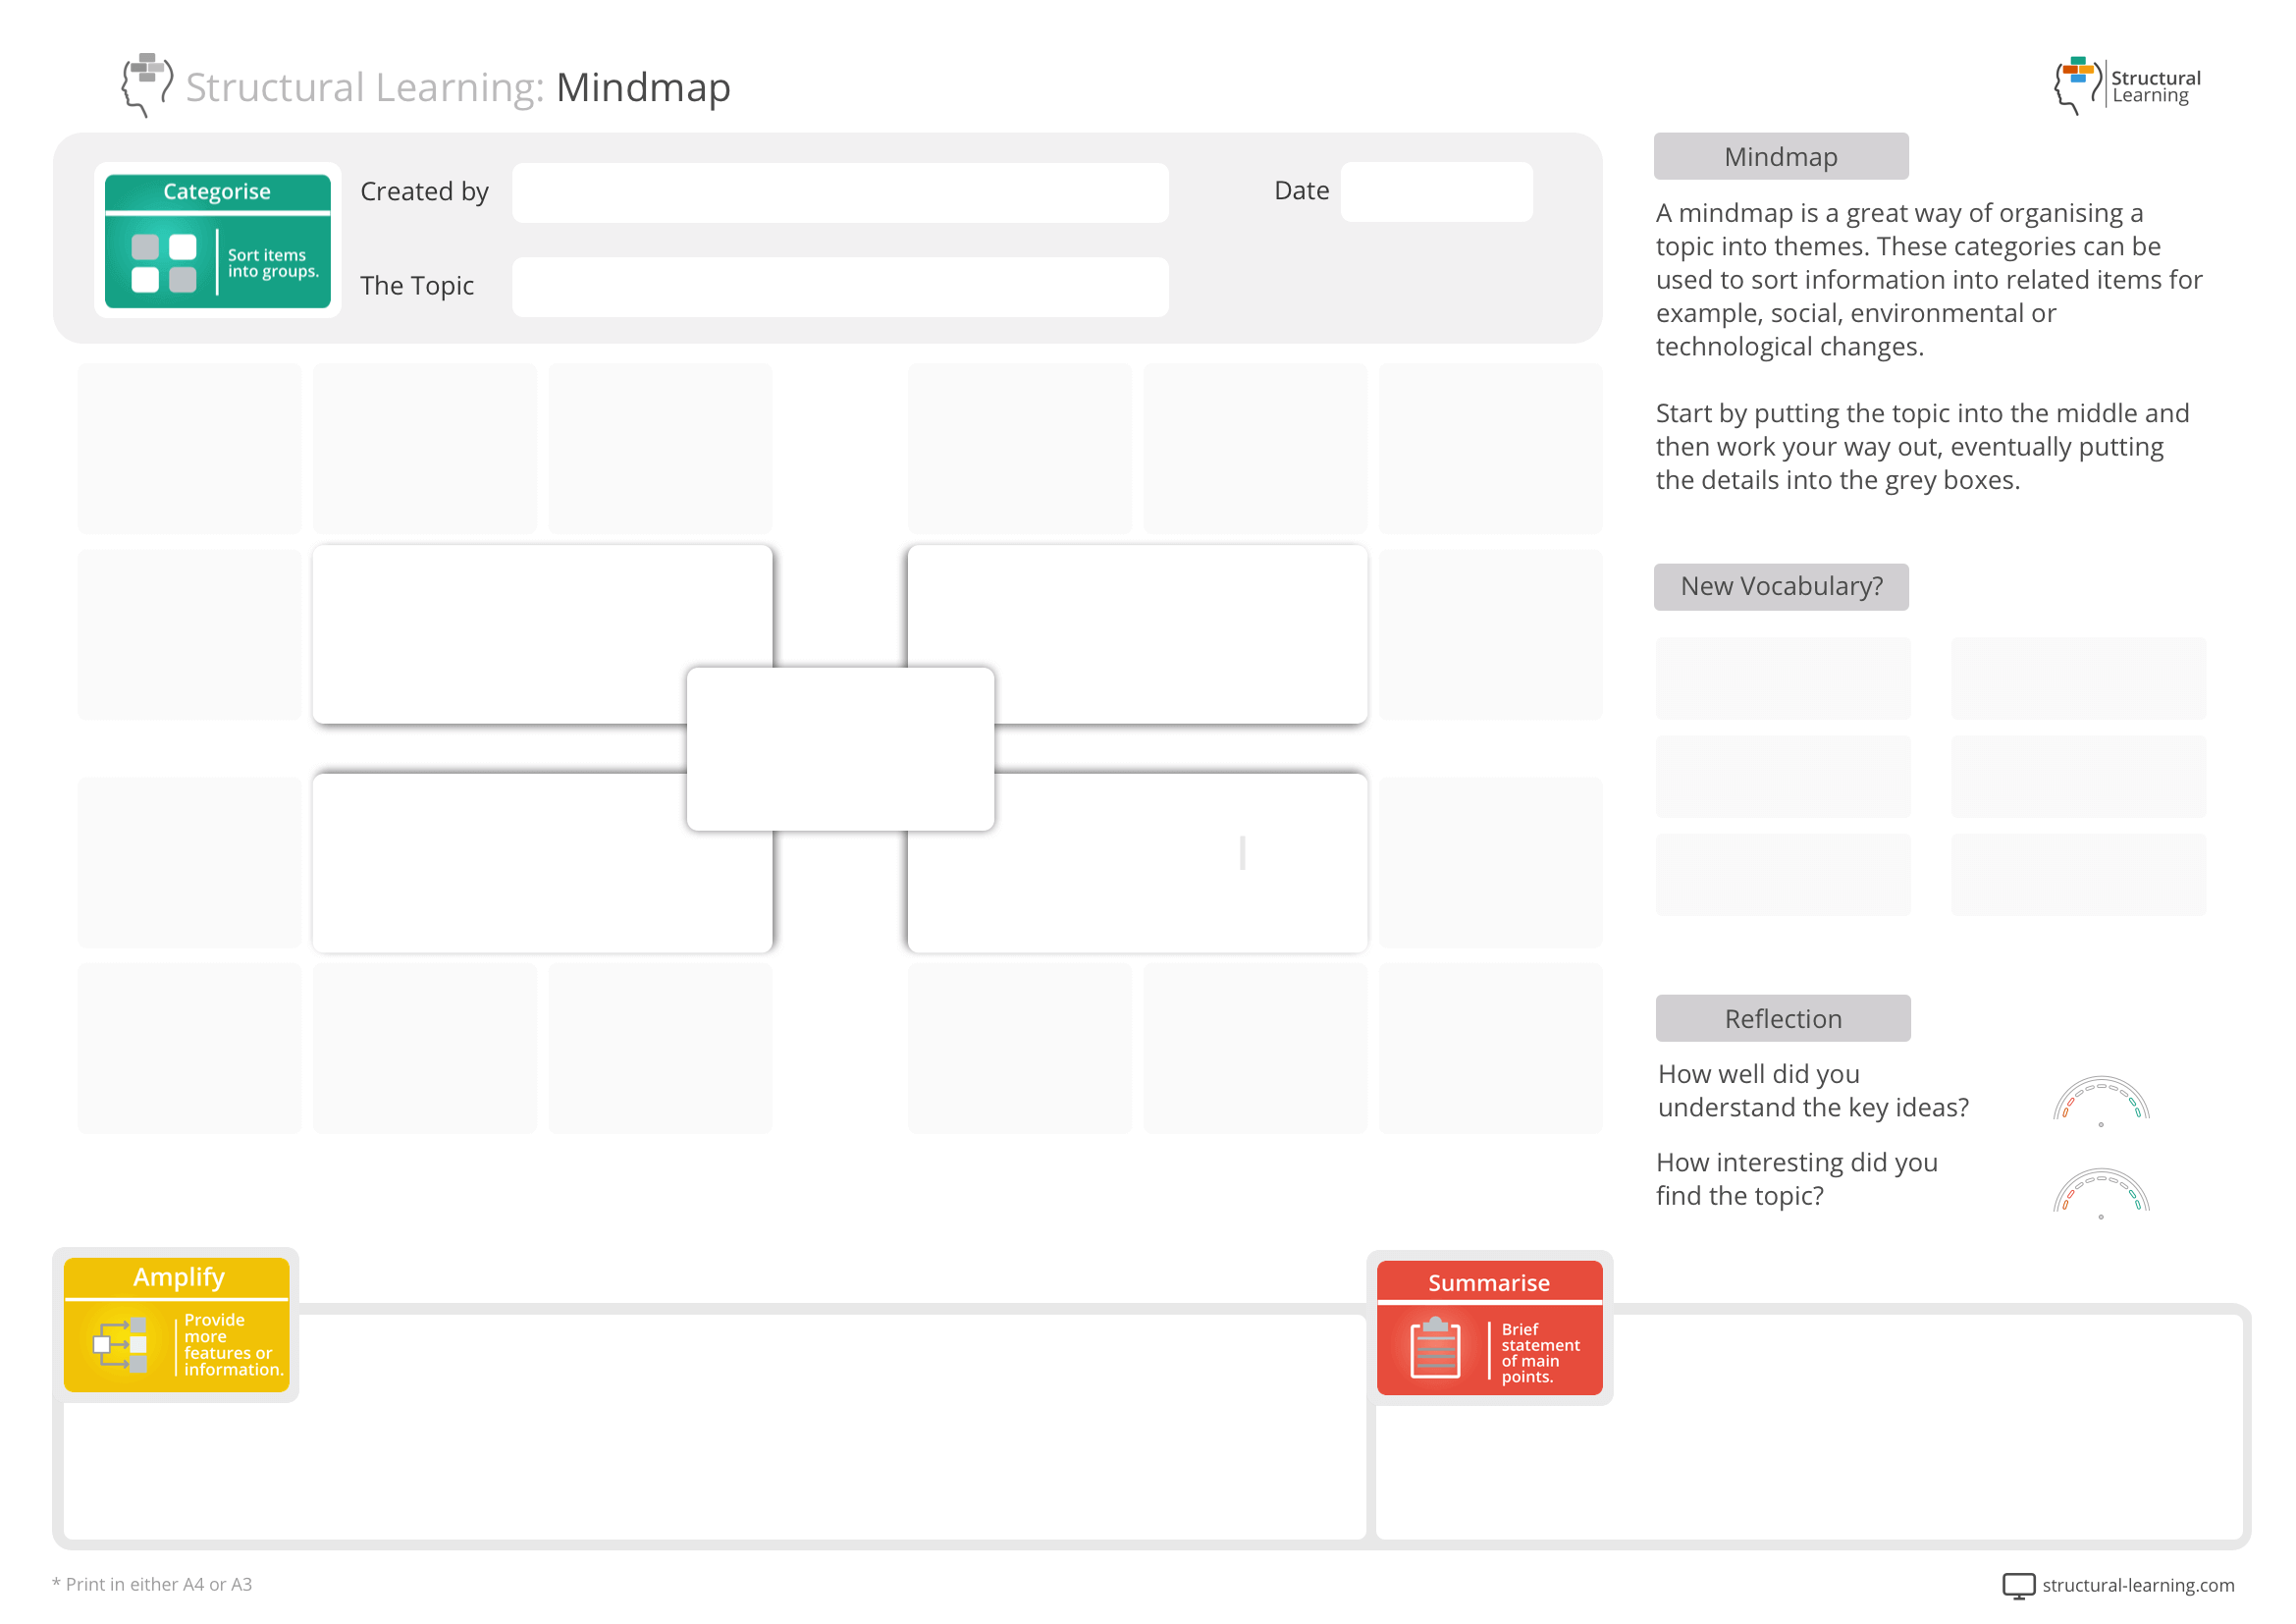
A mindmap is a great way of organising a topic into themes. These categories can be used to sort information into related items for example, social, environmental or technological changes.
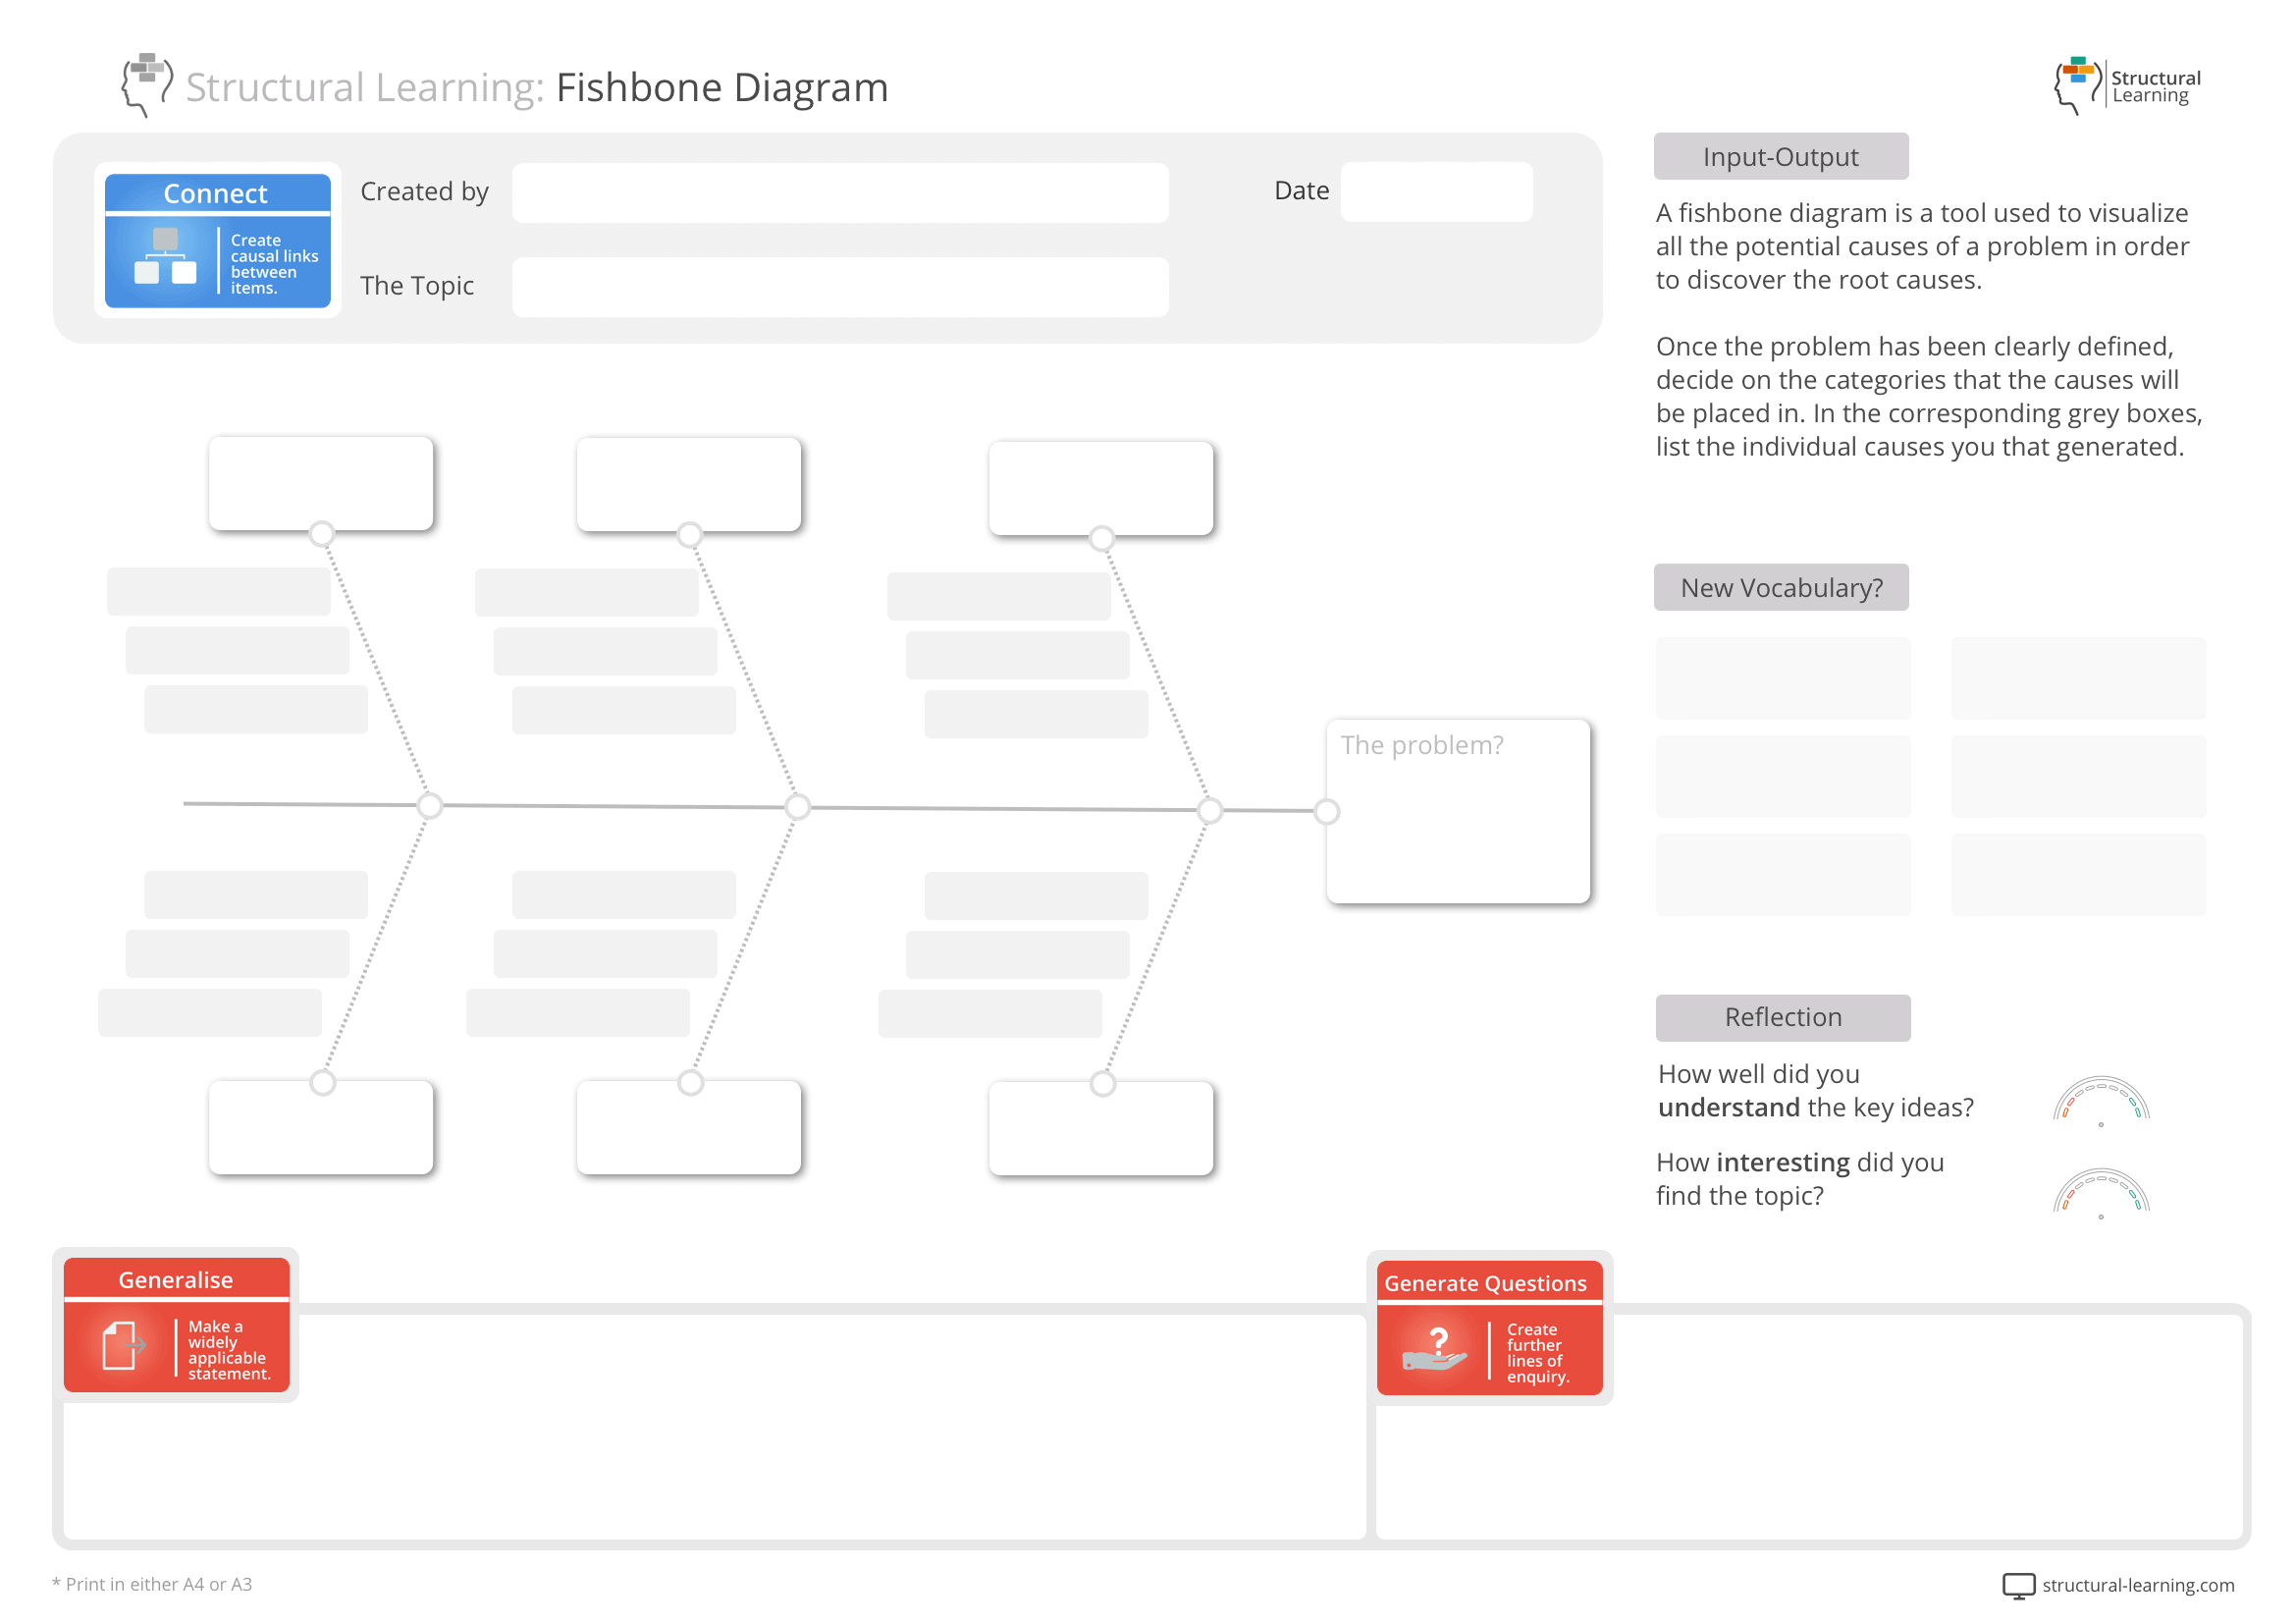
A fishbone diagram is a tool used to visualize all the potential causes of a problem in order to discover the root causes.

Venn diagrams are a good tool for comparing things. They can tell us what is similar and what is different about two or more items.

Flow Charts are graphical representations of processes, sequences or events. You are explaining what happened or how to do something chronologically.

Diamond 9 templates are a great tool when you need to rank or prioritise information. They can help us make a reasoned decision about something.
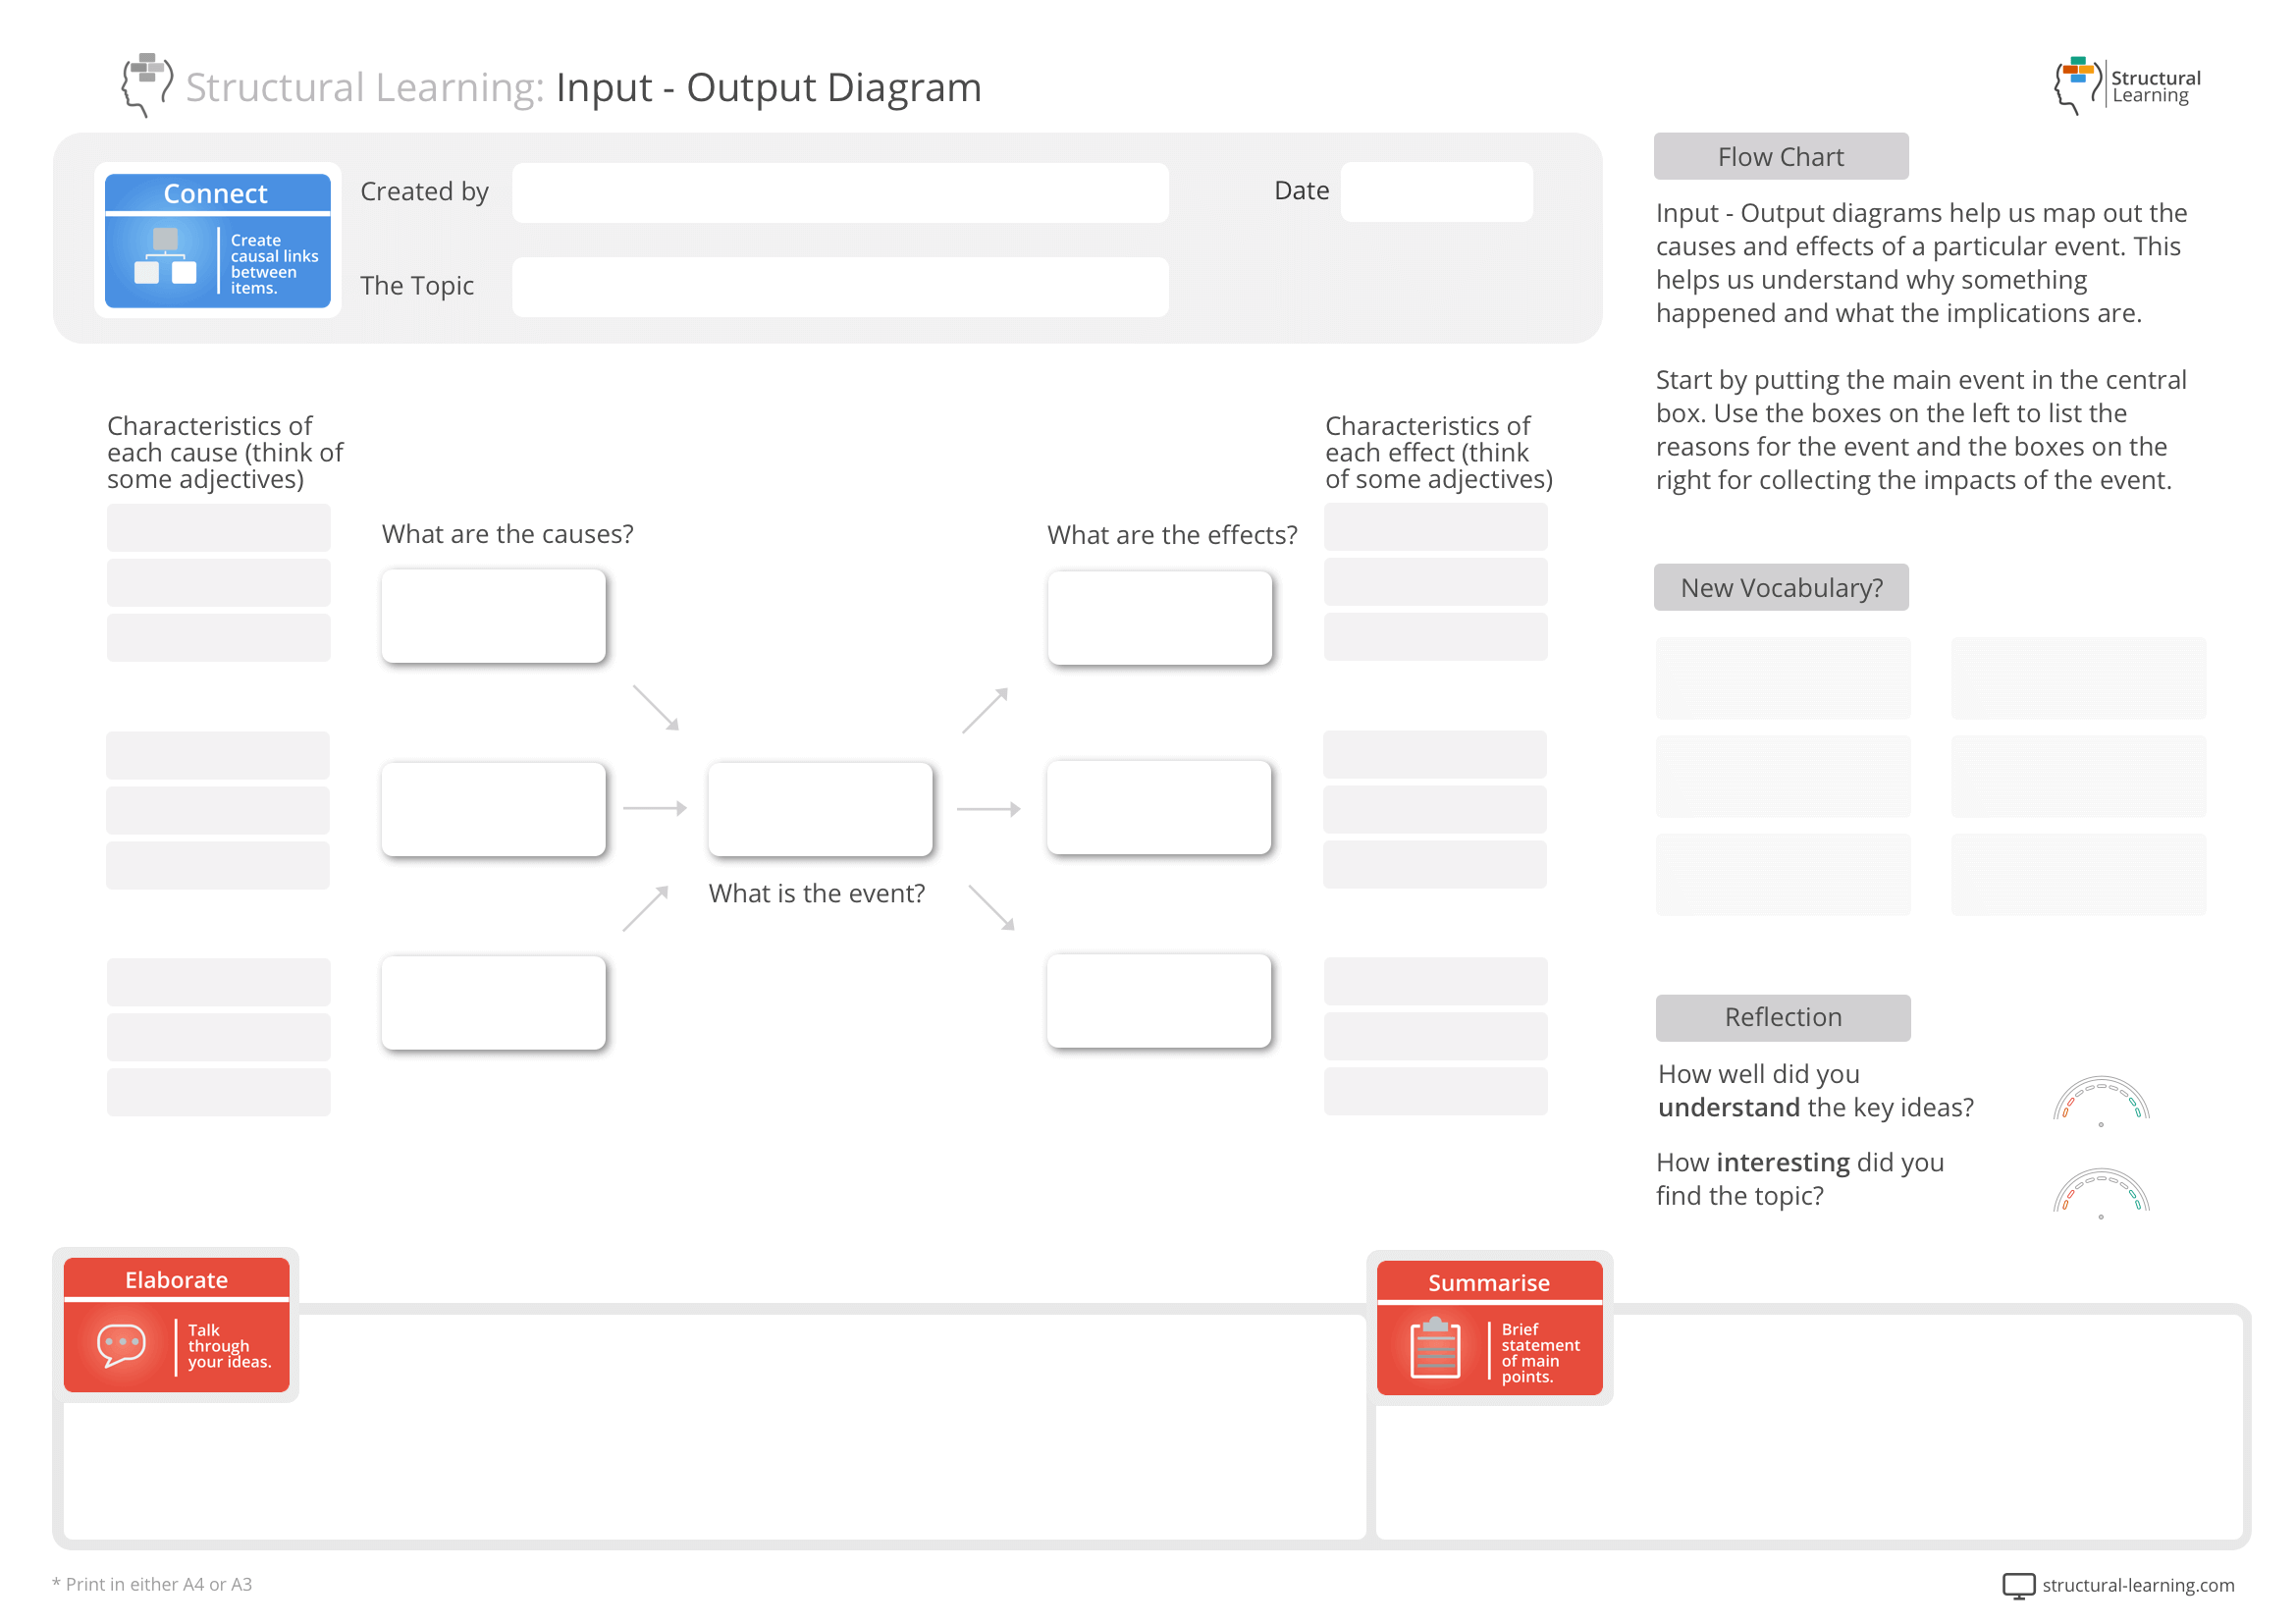
Input - Output diagrams help us map out the causes and effects of a particular event. This helps us understand why something happened and what the implications are.
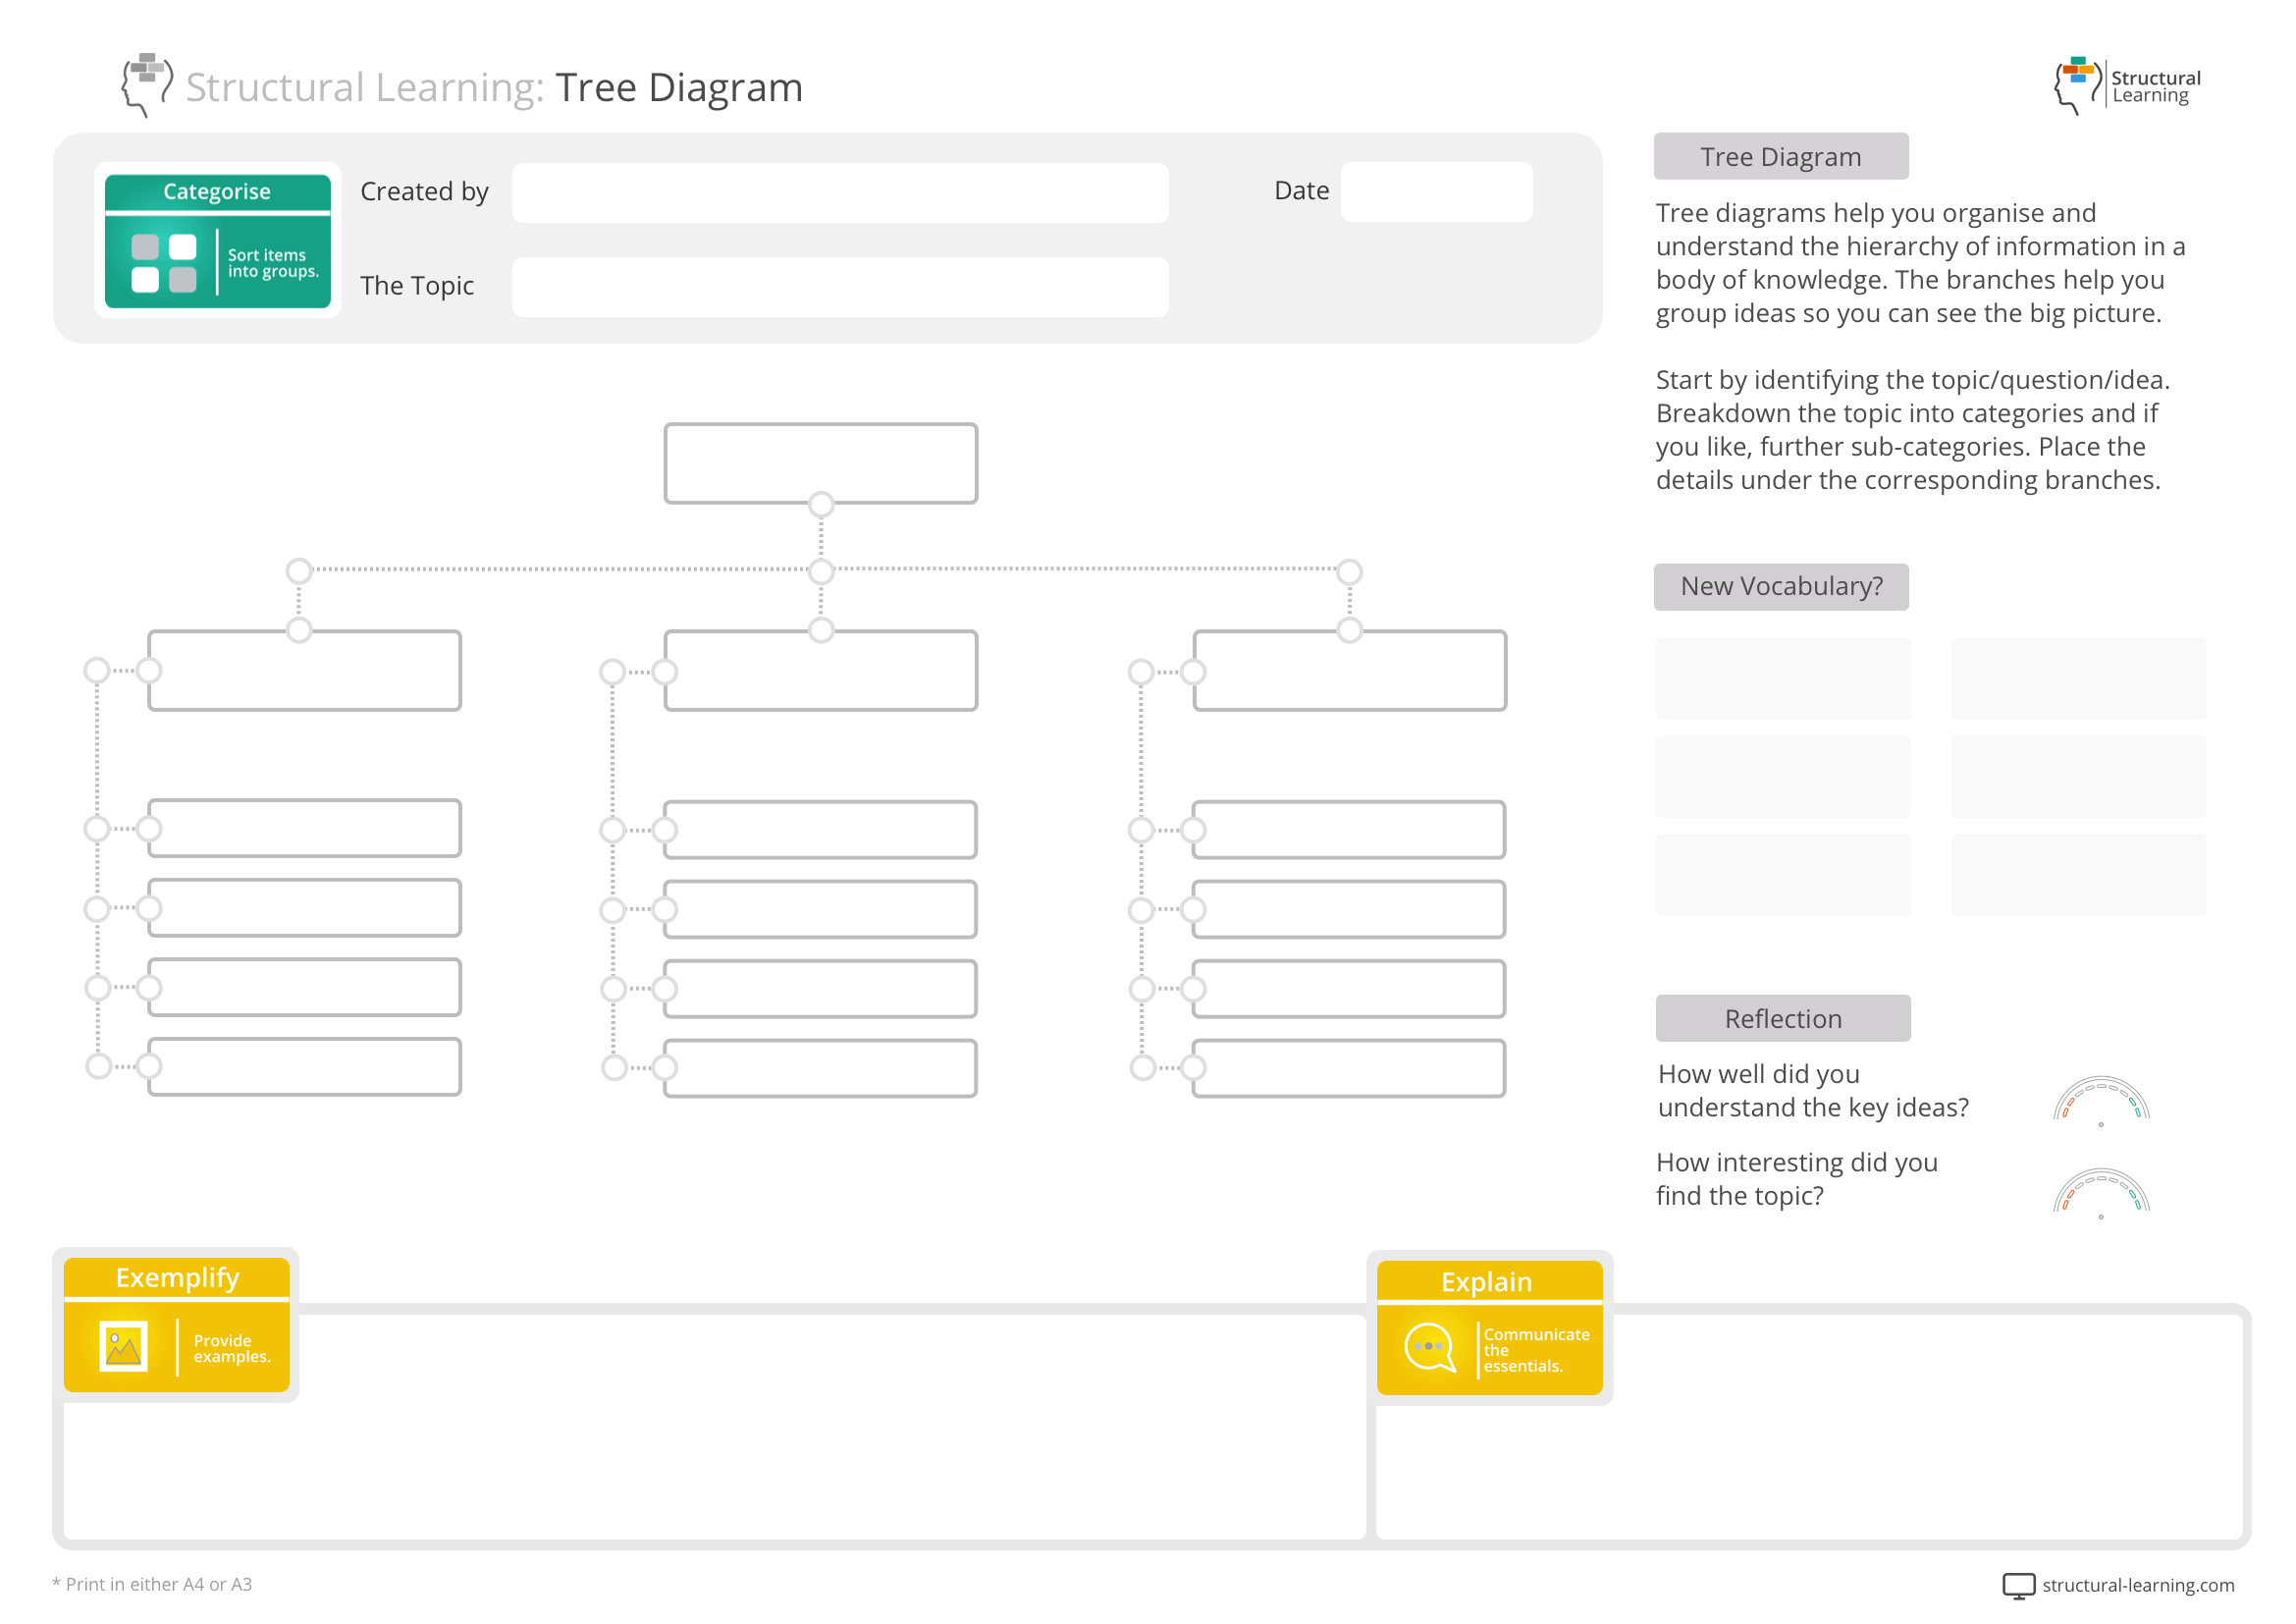
Tree diagrams help you organise and understand the hierarchy of information in a body of knowledge. The branches help you group ideas so you can see the big picture.